


The Ultimate List of Ecommerce Statistics for 2025


The ecommerce market is huge.
By the beginning of 2021, ecommerce sales hit $4.891 billion. In 2025, experts say we’ll have jumped to around $6.388 billion per year.
The demand for flexible, simple, and convenient buying opportunities has been growing for years now. Since the arrival of the first online stores, companies have rapidly begun closing brick-and-mortar locations in favor of more cost-effective online entities.
When the pandemic of 2020 hit, and stores were forced to shut down, online purchasing became the new normal. According to the latest statistics, the global share of ecommerce in retail trade leapt from 14% in 2019 to 17% in 2020.
Today, we’re going to be examining some of the biggest ecommerce statistics you need to know this year. Whether you’re planning on quickly picking the best eCommerce platform and opening your own online store, or you’re just looking for insights into what you can expect in the industry, this guide will help.
Key Ecommerce Statistics – Editor’s Choices
- Up to 95% of sales are expected to be conducted via ecommerce by 2040.
- Department store sales are expected to decline by 60% by the end of 2021
- In the US, ecommerce sales increased by 44% between 2019 and 2020
- Around 51% of today’s online shoppers conduct purchases via phones
- There are more than 2 billion people buying online worldwide
Ecommerce statistics: General market statistics
1. 95% of purchases will happen online by 2040
(Nasdaq)
Even before the pandemic, Nasdaq published a report in 2017 suggesting the majority of purchases will happen in the ecommerce environment by 2040. In the next 30 years, around 95% of all shopping will shift online, according to Nasdaq.
2. Credit cards and digital payment systems are most common for online shopping
(Shopify)
According to studies from Shopify, around 57% of online shoppers have purchased something from a global or overseas retailer. The preferred payment method for these shoppers varies around the world. However, credit cards are generally the most common choice worldwide, supporting around 53% of transactions. Digital payment systems enable 43% of sales, and debit cards are used for around 38% of sales. Digital payment systems are the most popular option in China and Western Europe.

3. 2.14 billion people are shopping online.
(Statisa)
As of 2021, the number of digital buyers active in the world is around 2.14 billion. To put that into perspective, it’s over a quarter (27.6%) of the 7.74 billion global population. The number of online shoppers has grown drastically in recent years. There were 900 million more buyers in 2021 than there were in 2020, for instance.
4. There are an estimate 12-124 million ecommerce sites worldwide
(WP Forms)
According to WP Forms, there are around 12-24 million ecommerce sites active around the world. Less than one million of these websites make more than $1,000 in revenue each year, however. Despite the saturation of the market, there’s still plenty of room for new competitors to come and take advantage of the ecommerce market.
Ecommerce statistics: Buyer Behavior
5. Lack of free shipping is the most common reason to avoid a purchase
(Digital Commerce)
Around 28% of customers say they avoid making a purchase due to a lack of a free shipping option. Another 23% say this issue prevents them from converting about half of the time, and another 23% say it’s a problem “once in a while.” Outside of free shipping issues, common reasons to decide against a purchase include worrying the item wouldn’t arrive on time (44%) and not having a clear delivery date (20%).

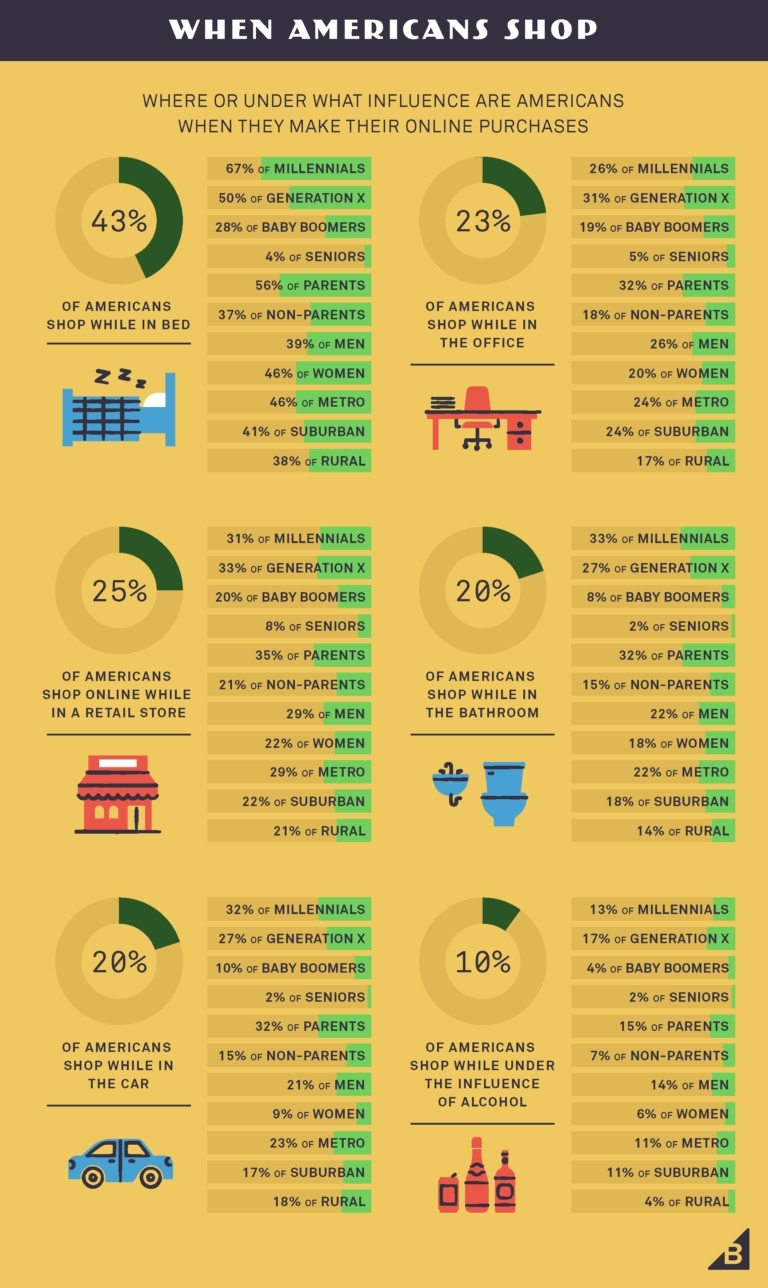
6. 43% of Americans shop online in bed
( BusinessWire )
BusinessWire found that around 43% of Americans shop for products when in bed, while around 25% shop online while visiting a retail store. Another 23% of customers say they’re commonly shopping when in the office, and 20% check out digital stores when in the bathroom.

7. Amazon is the top competitor to ecommerce stores for millennials
(Statista)
Amazon is the number one destination to shop for products online among millennials. One in five millennials say they go to Amazon first when looking for a product online. Around 59% also say they always or often begin their purchases with a trip to Amazon. Statista agrees with the power of Amazon, naming it the leading online retailer by number of visits.
However, around 87% of millennials also say they’re very likely to look at various websites or apps before buying.

8. 33.6% of customers look up price comparisons while in a store
( Pymnts.com )
Even when shopping in the brick-and-mortar world, consumers are still looking for a better deal online. According to the Remote Payments study by Pyments.com, around 46.4% of customers use their phone to search for discounts online or get a better deal. Around 48.1% of customers say they look for discounts every time they’re in a store, 35.5% say they look up product information, and 39.8% report comparing prices “some of the time.”

9. 81% of customers research their product before purchasing
( Invoca )
Research is crucial to ecommerce sales, with around 81% of customers looking up information about a product before making a purchase. The lack of information or reviews is particularly problematic for Millennials. According to Inviqa.com, around 40% of customers say lack of reviews or information is the biggest challenge they face when shopping online. 93% of millennials also say they’re likely or very likely to read reviews before a purchase.

10. 81% of customers trust the advice of their friends and family first
( HubSpot )
Around 81% of customers say they trust their friends and family’s advice when shopping online over the advice of a business. Around 55% say they don’t trust companies as much as they used to, and 65% don’t trust press releases from companies. 71% of consumers don’t respond to sponsored ads on social networks, and 69% don’t trust advertisements.

11. Localized language is essential to global purchases
( Shopify )
According to Shopify’s insights into global purchasing, around 65% of customers will prefer content in their own language, even if it’s not translated perfectly. Around 40% of customers refuse to purchase from a store entirely if the content is in another language. Around 66% of customers use online translation to help them understand a store.

Ecommerce Statistics: Ecommerce trends
12. 3 out of 4 consumers buy from their smartphones
( Oberlo )
The number of people accessing mobile shopping opportunities is growing. Three out of four customers say they buy online from their smartphone to save time. Oberlo estimates mobile commerce will have a value of $3.56 trillion by 2021, while Insider Intelligence believes mobile commerce volume will account for 44% of ecommerce transactions by 2026.

13. Online stores with a social media presence have up to 32% more sales on average
( BigCommerce )
According to a study into the collective data of over 20,000 ecommerce websites, social media presence does increase sales. On average, stores with at least one social account will make up to 32% more sales on average than sites without social media. The intermediate Facebook channel of an ecommerce business also grows at an average of around 8% per month.
Platforms like Crevio make it easier for ecommerce businesses to capitalize on the power of social media for sales growth. By offering tools like mobile-optimized ‘Link-In-Bio’ stores, they helps creators integrate their social presence directly with their online stores. This allows users to drive traffic from platforms like Instagram, Facebook, and TikTok and turn their followers into customers.
14. Customers referred to an ecommerce store by Instagram have an average order value of $65
( Shopify )
Encouraging customers to visit your store from social media can make a huge difference to sales. The average order value for customers referred from Instagram is $65, compared to $55 for Facebook, $46 for Twitter, and $38 for YouTube.
15. AI, Bots, and Automation make eCommerce More Effective
( Oracle )
78% of brands have already implemented or are planning to implement virtual reality or artificial intelligence in their ecommerce stores. According to sales and marketing professionals, around 80% of companies are already planning on using, or using chatbots in their CX plans.

16. 35% of customers say they’d shop online more often if they could virtually try a product before buying it.
( BigCommerce )
Opportunities are emerging in virtual and augmented reality environments. Polls show around 35% of people would shop online more often if they could try products on virtually before buying them. Another 22% of people say they’d be more likely to visit a store of AR was available. Extended reality may combine online and offline shopping.
17. Personalization can increase revenue by 25%
( BCG )
According to studies from BCG, highly personalized content makes customers 110% more likely to add additional items to their basket. Personalization can increase overall revenue by 25% and improve your customer’s chances of spending more than they originally planned by 40%.

18. The pandemic has increased the need for ecommerce transactions
( Deloitte )
Studies by Deloitte note there are several reasons why COVID-19 has accelerated the rise of online shopping. The most significant reason for customers to continue to shop online is to avoid the spread of germs. In 2020, food and beverage sales grew by 18.8% online, and the download of online shopping apps accelerated.
Ecommerce Statistics: Conversions Online
19. The average conversion rate of ecommerce websites is 2.58%
( Invespcro )
On average, the conversion rate for online stores is around 2.58% globally. The average ecommerce conversion in the US, on the other hand, is around 2.56%.

20. Around two-thirds of customers stop buying from a company due to bad CX
( Microsoft )
Customer experience is one of the most important elements in ensuring online sales. Around 58% of customers say they stop interacting with a business because of bad customer service. Research from Microsoft indicates some countries are more driven by experience than others. Around 63% of customers in the US will stop buying from a business due to bad CX.

21. 69.57% of shopping carts are abandoned
( Oberlo )
Convincing customers to finish a purchase is one of the biggest challenges faced by ecommerce brands. Around 69.57% of shopping carts end up abandoned, according to Oberlo. This suggests companies may need more strategies for remarketing and targeting customers who have left their shopping carts behind.

22. Cart Abandonment goes up when you require account creation at checkout
( Baymard Institute & NRF )
If you require customers to make an account before purchasing their intended item, their chance of abandoning their cart goes up by around 23%. A Separate study from NRF confirms these numbers, suggesting around 48% of retailers consider guest checkout to be one of the most critical factors for increasing sales and conversions. The only factor capable of increasing conversions more was free shipping (69.4%).

23. 18% of customers abandon checkout pages that are too complicated
( Baymard Institute )
There are several factors that might influence your conversion rates for an ecommerce store. Around 18% of US online shoppers have abandoned a purchase because the checkout process was too complicated or long. Baymard suggests most checkouts can reduce the number of form elements on their checkout pages by 20-60% and recover around $260 billion in lost sales.

24. Companies can reduce cart abandonment with shipping options
(eFulfillmentservice.com)
Free shipping is one of the best ways to increase conversions on an ecommerce site – but it’s not the only option., Around 58% of customers in a Fulfillment Service said they wanted free or discounted shipping when shopping online. However, 28% also said they want a choice of shipping options, such as paying more for a faster delivery.
Convenient shipping is particularly important for millennials, according to an Inviqa study. 27% of millennials say the most important thing a company can do to make shopping more convenient is to offer a choice of delivery options.

Ecommerce statistics for 2025 and beyond
The popularity and potential of ecommerce have been growing for some time now. Since the pandemic of 2020, the demand for online shopping opportunities is greater than ever. Some studies even suggest digital transformation in all industries has accelerated by around 7 years since 2020.
Stay ahead of the top ecommerce statistics, and you’ll be better prepared to deliver the kind of experiences your customers want most.
Click here to explore eCommerce platforms
Want to Learn More?
- Best Ecommerce Software Platforms
- Best Ecommerce Tools to Grow Your Online Store
- The Ultimate List of Email Marketing Statistics
Sources
[HubSpot](https://blog.hubspot.com/service/customer-acquisition-study? hstc=200701681.448f4caa5408e12806e11271b936f002.1542992562448.1542992562448.1547466725565.2& hssc=200701681.2.1547466725565&__hsfp=2938336133)
NRF


