- General Startup Statistics
- Startup Success Rate Statistics
- Startup Failure Rate Statistics
- Startup Growth Statistics
- Startup Funding Statistics & Facts
- Small Business Costs Statistics
- Startup Team Statistics
- Startup Demographic & Diversity Statistics
- Statistics for FinTech Startups
- Get Inspired by Startup Statistics
The Ultimate List of Startup Statistics for 2025


Table of Contents
- General Startup Statistics
- Startup Success Rate Statistics
- Startup Failure Rate Statistics
- Startup Growth Statistics
- Startup Funding Statistics & Facts
- Small Business Costs Statistics
- Startup Team Statistics
- Startup Demographic & Diversity Statistics
- Statistics for FinTech Startups
- Get Inspired by Startup Statistics
Looking for the latest startup statistics and trends? We’ve got you covered.
The startup world is dynamic and ever-changing — trends, technology, and new sectors are never stagnant. That’s why you must stay up to date with how the industry is doing.
But how can you be sure you’re keeping up with the times?
To stay up-to-date with the latest trends, we’ve compiled small business and startup statistics to better understand what starting a business really looks like. Whether you’re looking to launch a startup or just interested in diving into the statistics, check out these informative startup facts and stats on success, failure, diversity, and more before getting started. Let’s get nerdy!
Eye-Opening Startup Statistics
- About 90% of startups fail.
- Over 99% of U.S. businesses are considered small (less than 500 employees).
- More than 69% of U.S. entrepreneurs started their business at home.
- 79.7% of U.S. small businesses employ only the founder.
General Startup Statistics
- In 2021, there were 32.5 million small businesses registered and actively operating in the U.S. (SBA)
- In 2015, startups were responsible for the creation of over 2 million jobs in the U.S. (U.S. Census Bureau)
- Only 40% of startups are profitable. Another 30% of startups are likely to break, and the last 30% will continue to lose money. (Small Business Trends)
- In 2017, 67% of pre-Series A startups were already generating revenue before being funded – up from just 11% in 2010. (TechCrunch)
- 79.7% of U.S. small businesses employ only the founder. (National Association for the Self-Employed)
- Generally, startups spend about 11% of their revenue on their marketing budget. (Hubspot)
- Founders need 2 to 3x longer than they expect to validate a business model. (Forbes)
- In 2020, there were 475 “unicorns” in the world collectively worth a whopping $1.394 trillion. (CB insights)
- In the U.S, more than 69% of entrepreneurs started their business at home. (Small Business Trends)
- The time of year you pitch, the detailedness of your data, and the value of your pitch deck are a few of the strongest factors affecting the amount of funding a business receives. (Forbes)
- It only takes six days to start a business in the United States. (Dynado)
- 66% of small businesses will outsource services to other small businesses. (FreshBooks)
- Homeowners are 10% more likely to start a new business than those who don’t (U.S. Small Business Administration)
- 81% of American Small Business owners work overtime. (Fortunly)
- San Francisco and Silicon Valley account for 13.5% of global startup deals. (StartupsUSA)
- Japan is the least most entrepreneurial country with only 1.3% of natives being entrepreneurs. (Entrepreneur)

Startup Success Rate Statistics
-
American small businesses survival rates go as follows (Fundera):
- Around 80% of small businesses will survive their first year in business.
- About 70% of small businesses will survive their second year in business.
- Approx. 50% of small businesses will survive their fifth year in business.
- About 30% of small businesses will survive their 10th year in business.
-
Founders of previously successful businesses have a 30% chance of success with their next venture. (Skill vs. Luck in Entrepreneurship and VC)
-
82% of successful business owners admit they have the right qualifications and backed up experience to run a company, even with limited cash flow. (Small Business Trends)
-
Paying attention to your customers is important since 14% of startups fail due to not regarding customers’ needs. (Fundera)
-
The main challenge to the success of a startup is generating new business. (Statista)
-
Founders who have failed previously have a 20% chance of success while first-time founders have an 18% chance of success. (Skill vs. Luck in Entrepreneurship and VC)
-
In 2017, U.S. healthcare startups were the strongest industry, bringing in $36.3 billion in revenue along with Inc. 5000 companies. (Inc.)
Startup Failure Rate Statistics
- Startup statistics show that about 90% of startups fail. (Failory)
- The number one reason why startups fail is due to misreading market demand — this is found in 42% of cases. (CBInsights)
- The second largest reason why startups fail ( 29% of cases) is due to running out of funding and personal money. (CBInsights)
- Other notable cases of failure are a weak founding team ( 23% ) and being beat by competition (19%). (CBInsights)

- 10% of startups fail within the first year. (Failory)
- Failure is most common for startups during years two through five, with 70% falling into this category. (Failory)
- Failure because of competition most likely happens when a startup has been active for three to five years. (Failory)
- Across all industries, startup failure rates seem to be close to the same. (SBA)
- Other major reasons for startup failures ( at least 10% or above) are from pricing/cost issues, user-unfriendly products, poor marketing, and product mistiming. (CBInsights)
- In 2018, 82% of businesses that went under did so because of cash flow problems. (Fundera)
Startup Growth Statistics
- Companies that spend more on sales and marketing (as a % of revenue) generally grew at a faster rate than those that spent less. (Forentrepreneurs)
- SaaS companies invest between 80% and 120% of their revenue in sales and marketing in the first 5 years of their existence. (Tomasz Tunguz)
- Even if a software company is growing at 60% annually, its chances of becoming a multibillion-dollar giant are no better than 50/50. (McKinsey)
- In striking contrast to other industries, a software company that grows at only 20% , has a 92% chance of ceasing to exist within a few years. (McKinsey)
- High-growth companies offer a return to shareholders 5 times greater than medium-growth companies. (McKinsey)
Startup Funding Statistics & Facts
- Less than 6% of all new businesses started in the US in 2018 were funded by venture capital. (Kauffman Foundation)
- Companies raise nearly three rounds before they get to Series A funding. (TechCrunch)
- The average seed capital raised prior to Series A amounts to $5.6 million. (TechCrunch)
- On average, the size of Series A round is $15.7million , Series B is $30.7 million , and Series C is $55 million. (Fundz)

- The average time between funding rounds from Seed to Series A is 22 months , Series A to B is 24 months , and Series B to Series C is 27 months. (Carta)
- Once you get to a Series B or C round, you’ll probably work for 15 to 20 months before bringing in new capital. (Forbes)
- Individual venture capital firms receive more than 1,000 proposals a year and are mostly interested in businesses that require an investment of at least $250,000. (Money Crashers)
- 33% of startup capital for employer firms is less than $10,000. (SBA 2017)
- 12% of startup capital for employer firms is $250,000 or more. (SBA 2017)
- Venture capital funding reached a decade-high of $155 billion in 2017. (KPMG)
- About 1% of startups evolve into a unicorn startup, like Uber, Airbnb, Slack, Stripe, and Docker. (CBInsights)
- In 2018, male founders brought in $109.36 billion in VC, while female founders only brought in $2.86 billion in VC. (PitchBook)
- Valued at $75 billion , Bytedance, a Beijing-based news and information content platform, was the top valued startup by venture capital firms worldwide in March 2019. (Statista)
- One in four businesses, surveyed by the NSBA, were not able to receive the funding they required, which led to limiting the growth of their business. (Fundera)
- 1 in 3 begin their small business with less than $5,000. (Small Business Trends)
- Business loans, credit cards, and lines of credit account for about ¾ of financing for new firms. (SBA)
Small Business Costs Statistics
While startup costs have decreased dramatically over the last decade, there are still major unavoidable expenditures involved. While your startup costs will largely depend on where your startup is based, our startup costs statistics will help you ballpark what you might need to get your business off the ground.
- More than 47% of Series A startups spend over $400k per month. (Fundz)
- One of the most expensive startup costs is payroll, averaging around $300,500 for five employees across the U.S. (Smart Asset)
- The most popular financing method for startups costs in 2018 was personal funds at 77%. (Lendio 2018 survey)
- Large unicorn startups, such as Airbnb and Uber, have taken a billion dollars or more in debt in order to become more successful. (PitchBook)
- Equipment costs for startups can range anywhere from $10,000 to $125,000. (Fundera)
- The median income for an entrepreneur / small business owner is $59,000. (Finances Online)
- Recent research has shown the most expensive small businesses and startups to launch are restaurants, medical offices, and manufacturing companies, needing more than $100,000 to get started. (Small Business Trends)
- Startups in accounting, online retail, construction, and landscaping were most likely to get started with under $5,000 in startup costs, shown in recent research. (Small Business Trends)
- One of the biggest challenges to the survival of small businesses and startups is the cost of health insurance. (NSBA)
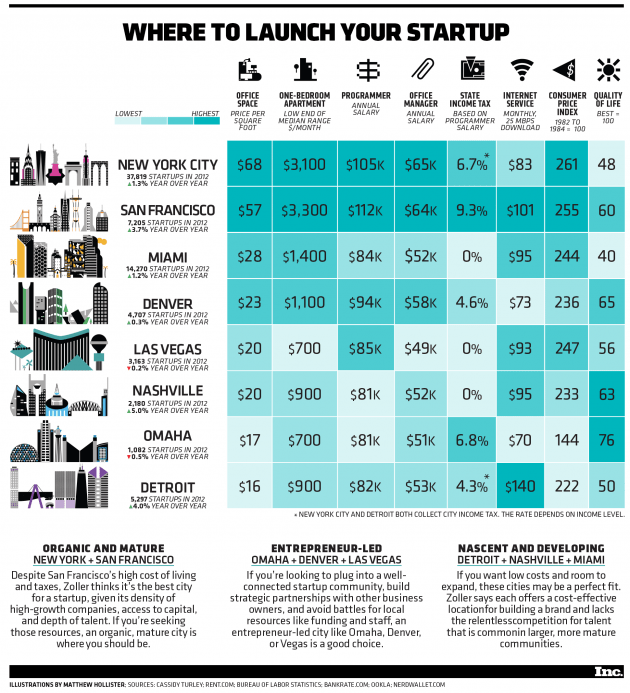 Source: Inc

Startup Team Statistics
In the startup world, there is no such thing as a solo entrepreneur or one-man-show. Nobody who’s ever scaled the business from the ground up did it alone. Startups are built on complementary skills of founders and early employees who drive growth despite often unfavorable circumstances. The following statistics will give you an insight into a typical startup team before you build your own.
- Teams with more than one founder outperformed solo founders by a whopping 163% (First Round Capital)
- Over 99% of U.S. businesses are considered small (less than 500 employees). (SBA)
- On average, it takes six months to hire someone for a startup. (Forbes)
- Startup teams that reported high levels of previous experience but average to low levels of passion and collective vision were overall weaker. (Harvard Business Review)
- Startup owners can spend around 40% of their working hours on tasks that do not generate income such as hiring, HR tasks, and payroll. (Entrepreneur)
- Startup failure is most common when the company has 11–50 employees. (Failory)
- Two founders increase the odds of a startup’s success with 30% more investment, three times the customer growth rate, and a higher likelihood the startup will not scale too fast. (Small Business Trends)
- Only 50% of businesses with employees survive past the first five years.
- 23% of startups mentioned team issues leading to failure. (Entrepreneur)
- Experience alone does not make a team successful — soft skills such as “entrepreneurial passion” and “shared strategic vision” are required as well. (Harvard Business Review)
- Over 50% of small businesses have a Chief Financial Officer. (Wall Street Journal)
Startup Demographic & Diversity Statistics
A lack of diversity is hardly unique to the startup sector. Startups have a diversity problem because the tech sector at large has a large diversity gap. These startup diversity statics will help you see how a diverse team can contribute to the growth of your startup and why a gender balance at leadership levels should be a norm rather than a rarity.
Startup Statistics by Gender
- Male entrepreneurs own 14.8 million businesses in the US. (Finances Online)
- Female entrepreneurs own 9.9 million small businesses in the US. (Finances Online)
- Companies with a female founder performed 63% better than their counterparts with all-male founding teams. (First Round Capital)
- The ratio of men entrepreneurs to women entrepreneurs in 2019 is 10:7. (Global Entrepreneurship Monitor)
- According to startup statistics, only 14.8% of European startup founders in 2016 were women. (Forbes)
- 53% of American startups have at least one woman in an executive position. (Fortunly)
- 9 of the 21 co-founded startup companies in the US, which earned more than $20 million in annual revenue in 2018 had an all-female co-founding team. (Medium)
Startup Statistics by Ethnicity
- Immigrant entrepreneurs start 25% of all new businesses in the U.S. – up from 13.3% in 1996. (Forbes)
- Businesses founded by immigrant entrepreneurs create 42% more jobs in America than ones started by their U.S.-born counterparts. (MIT Sloan)
- Just 1% of venture-funded startup founders are black. (BLCK VC)
Startup Statistics by Education
- Businesses with at least one founder who attended an Ivy League school performed 220% better than other startup teams. (First Round Capital)
- 95% of entrepreneurs have at least a bachelor’s degree. (Kauffman Foundation)
- As of 2019, Stanford, Harvard, and the University of California are the top three colleges for unicorn founders. (Factinate)
- Founding teams with experience at big tech companies built startups that performed 160% better than others. (First Round Capital)
Startup Statistics by Age
- First Round Capital found out that teams with an average founder age of under 25 perform nearly 30% above their portfolio average. (First Round Capital)
- 35% of entrepreneurs are 50-59 years old, 25% are 40-49 years old, and 18% 60-69 years old. (Finances Online)
- A 2018 study shows that a 60-year-old is 3x as likely to build a successful startup than a 30-year-old. (Kellogg Insight)
Statistics for FinTech Startups
- The fintech market includes 39 VC-backed unicorns worth a combined $147.37 billion. (CB Insights)
- The global fintech market size is projected to reach USD 460 billion by 2025. (GlobeNewsWire)
- About 46 % of today’s consumers use digital channels exclusively for their personal banking. (Singularity University)
- About 30% of consumers plan to increase their use of non-traditional financial services providers, but only 39% plan to continue using solely traditional service providers. (ICBA)
- 88 % of legacy banking organizations fear losing revenue to financial technology companies in areas such as payments, money transfers, and personal loans. (PwC)
- 82% of traditional financial institutions say they plan to increase collaboration with fintech startups within the next three to five years. (PwC)
Get Inspired by Startup Statistics
Thinking about launching your own venture?
Don’t let the startup statistics above put you off. After all, if you’ve read carefully, you know you’re more likely to succeed if you’ve failed than if you’ve never tried.
No matter what your goals are – whether they’re related to launching a new venture, finding a co-founder, or getting a new round of financing – reading up on the latest stats within each startup category is a great way to ensure you stay up-to-date and make informed business decisions.
Further Reading Related to Startup Statistics:
Sources
Global Entrepreneurship Monitor
Fundera
European Startup Monitor


