
( 166 )
Better Stack Reviews: 4.8/5 — Highly Rated
Better Stack lets you see inside any stack, debug any issue, and resolve any incident. Visualize your entire stack, aggregate all your logs into structured data, and query everything like a single database with SQL. Monitor everything from websites to servers. Schedule on-call rotations, get actionable alerts, and resolve incidents faster than ever. Made to fit into your workflow with over 100+ integrations.


| Capabilities |
API
CLI
|
|---|---|
| Segment |
Small Business
Mid Market
Freelancer
Enterprise
|
| Ease of use |
Beginner
Intermediate
Advanced
|
| Deployment | Cloud / SaaS / Web-Based, Mobile Android, Mobile iPad, Mobile iPhone |
| Support | 24/7 (Live rep), Chat, Email/Help Desk, FAQs/Forum, Knowledge Base, Phone Support |
| Training | Documentation, In Person, Live Online, Videos |
| Languages | English |

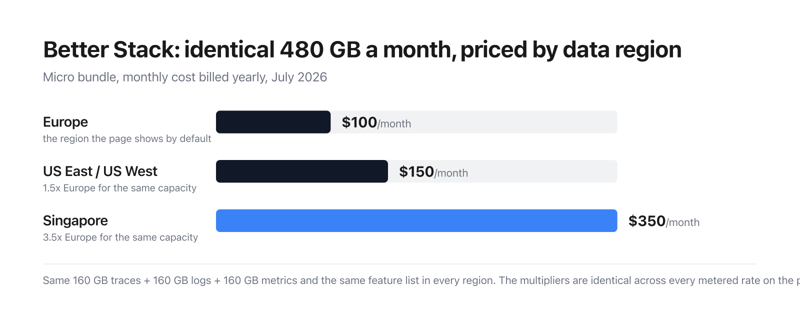
Better Stack’s Micro bundle costs $100 a month in Europe, $150 in the United States and $350 in Singapore — for exactly the same 480 GB and exactly the same feature list. Every metered rate on the page carries the same multipliers: US is 1.5× Europe, Singapore is 3.5×. The page opens on Europe, the cheapest of the four. Choosing where your data lives is the single largest decision on Better Stack’s price list, and it is made by a dropdown most buyers will scroll straight past.
- What it is: A combined observability and incident-management platform — logs, metrics, traces, errors, uptime monitoring, on-call and status pages.
- Best for: Teams that can host in Europe and want one vendor instead of five.
- Pricing: Free tier, then $29 per responder per month billed yearly. Telemetry billed separately. Verified July 2026.
- The honest catch: The platform costs $29; a fully-equipped status page costs $886.
What Is Better Stack?
Better Stack bundles a set of products usually bought separately: log and trace aggregation queryable with SQL, PromQL or a drag-and-drop builder, metrics, error tracking, session replay, web events, uptime and Playwright transaction monitoring, cron heartbeats, on-call scheduling, incident management inside Slack or Teams, branded status pages, and a Slack-native AI SRE agent that investigates incidents against your telemetry.
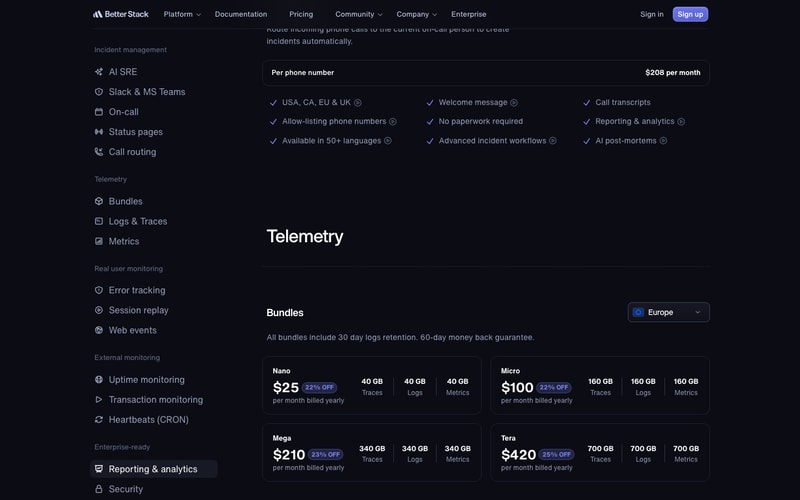
Pricing is à la carte rather than tiered. There is one licence price and a long list of separately metered components.
How Better Stack Works
- One responder licence, then metered add-ons.
- Team members are free; responders are not.
- Telemetry is billed by volume, in bundles or pay-as-you-go.
- Data region multiplies every rate.
- Status-page features are the costliest add-ons.
- 60-day money-back guarantee.
Better Stack Pricing
Captured from Better Stack’s pricing page in July 2026 in US dollars, reading both billing toggles and all four data regions.
| Component | Monthly | Billed yearly | Unit |
|---|---|---|---|
| Free tier | $0 | $0 | 10 monitors, 1 status page, 100k exceptions, 5,000 replays |
| Responder licence | $34 | $29 | per licence per month |
| Team members | $0 | $0 | unlimited |
| Slack channel/thread workflows | $9 | $9 | per responder licence per month |
| Reporting & analytics | $5 | $4 | per member per month |
| Additional 50 monitors | $25 | $21 | per month |
| Additional 10 heartbeats | $20 | $17 | per month |
| SSO with Azure or Okta | $5 | $5 | per user per month |
| Audit logs | $250 | $208 | per month |
| Call routing | $250 | $208 | per phone number per month |
| Telemetry bundle | Europe | US East/West | Singapore | Capacity |
|---|---|---|---|---|
| Nano | $25 | $38 | $88 | 40 GB each of traces, logs, metrics |
| Micro | $100 | $150 | $350 | 160 GB each |
| Mega | $210 | $315 | $735 | 340 GB each |
| Tera | $420 | $630 | $1,470 | 700 GB each |
| Multiplier | 1.0× | 1.5× | 3.5× | identical features |
What actually decides your cost:
- Data residency is the biggest multiplier on the page, and it is exact. Europe is the baseline. US East and US West both cost 1.5×. Singapore costs 3.5×. This is not approximate: logs ingestion runs $0.10, $0.15 and $0.35 per GB; metrics retention $0.50, $0.75 and $1.75 per GB per month; error tracking $0.000050, $0.000075 and $0.000175 per exception; session replay $0.00150, $0.00225 and $0.00525 each. Every one is precisely 1.5× and 3.5× the European rate, with only the logs retention figure rounded for display. The capacity and the feature list are identical in all four regions. If your compliance position lets you host in Europe, that choice is worth more than every discount on the page combined.
- The comparison claims do not move with the region, though the prices do. Beside the error-tracking rate the page reads “approx. 6x cheaper than Sentry”, and the section is headed “Sentry-compatible at 1/6th the price.” That text is byte-for-byte identical whether the rate showing is $0.000050 (Europe) or $0.000175 (Singapore) — a spread of 3.5×. The same is true of “up to 2x cheaper than PostHog” on session replay and “At 1/10 of the cost of PostHog or Amplitude” on web events. Whatever the comparison is worth in Europe, it cannot hold equally in Singapore at three and a half times the price.
- The discount badges are honest, and they are off the pay-as-you-go rate — not off each other. Each bundle shows two percentages, and both reconcile exactly against the metered rates published further down the same page. Nano’s 40 GB of logs, traces and metrics costs $32 a month at European pay-as-you-go rates ($6 logs, $6 traces, $20 metrics); the bundle is $30 monthly, 6.25% off — badged “6% OFF” — and $25 yearly, 21.9% off, badged “22% OFF”. The same arithmetic lands on 8%/23% for Mega and 11%/25% for Tera. Verifiable discount claims are rare enough to be worth saying out loud.
- Metrics are 62.5% of every telemetry bill while being a third of the data. Metrics retention costs $0.50 per GB per month against $0.15 all-in for logs — 3.3×. Because the bundles allocate equal gigabytes to traces, logs and metrics, metrics account for exactly 62.5% of the pay-as-you-go equivalent of all four bundles. If you are choosing a bundle size, model your metrics volume first; the logs figure that gives the bundle its name is the cheap third.
- The platform costs $29; the status page costs up to $886. One status page is included, but its options are priced per page per month at yearly rates: white-labelling $208, IP allowlisting $208, single sign-on $208, sending e-mail from your own domain $208, password authentication $42 and custom CSS/JavaScript $12. A single fully-equipped status page therefore runs $886 a month — over 30 times a responder licence, and $1,065 if billed monthly. For a company that wants a branded status page without Better Stack’s footer on it, that one line will dominate the invoice.
- “Unlimited team members” is true until you want reporting. Members are explicitly $0 per member per month, which is genuinely generous next to the per-seat norm in this category. But Reporting & analytics is charged per member, not per responder — $4 each billed yearly. A forty-person engineering organisation with three responders pays $87 for licences and $160 for reporting: the reporting add-on costs nearly twice the platform. Azure and Okta SSO are also per user at $5, while Google SSO is free.
- Heartbeats cost four times what monitors cost. Extra monitors are $21 per 50 (42¢ each); extra heartbeats are $17 per 10 ($1.70 each) — a 4× difference per unit for what is, from outside, a simpler check. Ten of each are included free.
Who Should Use Better Stack
- Teams consolidating five tools into one. The clearest case — logs, metrics, errors, uptime, on-call and status pages under one bill.
- Anyone who can host data in Europe. The same platform at a third of the Singapore price.
- Small teams and side projects. The free tier is unusually complete: 10 monitors, a status page, 100,000 exceptions and 5,000 session replays a month.
- Organisations with many observers and few responders. Free unlimited members is worth real money at scale.
It fits poorly for teams needing Singapore or US data residency on a tight budget; for anyone whose status page must be white-labelled and access-controlled; for metrics-heavy workloads; and for HIPAA-regulated organisations, which Better Stack says outright it cannot serve.
Honest Pros and Cons
Strengths
- A genuinely usable free tier, not a trial.
- Unlimited team members at $0.
- Discount badges that reconcile exactly with the published rates.
- 60-day money-back guarantee — twice the usual 30.
- SOC 2 Type 2, ISO 27001, GDPR, EU storage by default.
- Says plainly it is not HIPAA compliant rather than staying quiet.
Limitations
- Singapore costs 3.5× Europe for identical capacity.
- Comparison claims stay fixed while prices vary 3.5×.
- $208 per page per month for white-labelling, SSO and IP allowlisting.
- Reporting is billed per member, undercutting free seats.
- Metrics are 62.5% of every bundle’s underlying cost.
- Extra heartbeats cost 4× extra monitors, per unit.
Better Stack Alternatives and How It Compares
- Datadog is the full-coverage incumbent Better Stack’s own footer benchmarks against.
- Sentry is the error-tracking standard, and the target of the “1/6th the price” claim.
- PostHog covers session replay and product analytics, named in two claims on the page.
- Grafana Cloud is the closest open-source-rooted alternative for logs and metrics.
- PagerDuty competes specifically on on-call and incident response.
The Verdict
Better Stack is doing something unusual, and mostly doing it well. Rather than a three-tier ladder, it publishes one $29 responder licence and then meters everything else openly — a free tier that is genuinely usable, unlimited team members at no cost, and telemetry priced by the gigabyte with bundles on top. The discount badges even survive checking: Nano’s “6% OFF” and “22% OFF” reconcile to 6.25% and 21.9% against the pay-as-you-go rates published further down the same page, and the same arithmetic holds for all four bundles. Vendors whose percentages can be audited from their own price list are a minority.
The thing to understand before comparing Better Stack with anything else is that the data-region dropdown is the most expensive control on the page. Europe is the baseline; US East and US West cost exactly 1.5×; Singapore costs exactly 3.5× — and that multiplier applies to every metered rate, not just the bundles. The Micro bundle is $100, $150 or $350 a month for the identical 480 GB and the identical feature list. The page opens on Europe, the cheapest of the four, so the figure a casual reader takes away is the best case. Anyone with a compliance requirement pinning data to Singapore should re-price the whole platform before drawing conclusions.
That regional spread also strains the comparative marketing. “Approx. 6x cheaper than Sentry” sits beside the error-tracking rate in every region, unchanged, while that rate ranges from $0.000050 to $0.000175 per exception. The same static claims accompany session replay (“up to 2x cheaper than PostHog”) and web events (“1/10 of the cost of PostHog or Amplitude”). These are not false so much as unqualified: they can only describe one region at a time, and the page never says which.
Two more numbers deserve a place in any budget. Metrics retention costs 3.3× what logs cost per gigabyte, which means metrics are 62.5% of the underlying cost of every bundle despite being a third of the data — so size your bundle on metrics, not logs. And the status-page add-ons are the steepest line on the page: white-labelling, SSO, IP allowlisting and custom-domain e-mail are $208 per page per month each, so a fully-equipped status page reaches $886 a month, more than thirty times a responder licence. Host in Europe, watch your metrics volume, and decide early whether that status page really needs to be unbranded.
FAQ
How much does Better Stack cost?
There is a free tier, then $34 per responder per month monthly or $29 billed yearly. Team members are unlimited and free. Telemetry is billed separately, either pay-as-you-go or in bundles from $25 to $420 a month on European rates. Add-ons — extra monitors, heartbeats, status-page features, reporting, audit logs — are metered individually. A 60-day money-back guarantee applies.
Why does Better Stack’s price change when I pick a different data region?
Because the region multiplies every metered rate. Europe is the baseline, US East and US West cost 1.5×, and Singapore costs 3.5× — for identical capacity and an identical feature list. Logs run $0.10, $0.15 and $0.35 per GB; metrics retention $0.50, $0.75 and $1.75 per GB per month. The page opens on Europe, so the prices shown by default are the lowest available.
Is Better Stack really six times cheaper than Sentry?
That is Better Stack’s claim, printed beside its error-tracking rate — but the claim never changes while the rate does. It appears identically at $0.000050 per exception in Europe and $0.000175 in Singapore, a 3.5× spread. Whatever ratio holds in one region cannot hold in all of them, and the page does not say which region the comparison refers to.
Is Better Stack’s free plan actually usable?
More than most. It covers 10 monitors and heartbeats, one status page, 100,000 exceptions a month, 5,000 session replays, 3 GB each of logs, traces and web events retained for three days, and 30 GB of metrics — with Slack and e-mail alerts. It is labelled “free for personal projects”, and the three-day retention is the main constraint for anything production-facing.
What does a branded status page cost on Better Stack?
One status page is included with a licence, but the options are charged per page per month at yearly rates: white-labelling to remove the “Powered by Better Stack” footer is $208, as are single sign-on, IP allowlisting and sending e-mail from your own domain. Password authentication is $42 and custom CSS/JavaScript $12. A page with all of them costs $886 a month, against $29 for the responder licence itself.


Easy to set up, easy to use. The free plan has what we need to monitor our webshop.
We're currently delighted with the available features.
We're able to quantify our uptime independently. Now we're able to communicate easier with our developers.
The oncall scheduling is very easy to set up and maintain. The alerting is reliable and has all the necessary info. Screenshots are a great feature.
Victor ops integration is only in private beta now...
Oncall scheduling of our devops team
The app is super easy to setup. It took me like 5 minutes to get everything up and running. The free plan offers up to 10 monitors, which is amazing for any smaller project. Also, it includes a status page, which has a very neat design and integrates with the monitors quickly.
The advanced plans are quite expensive for individuals, but I understand that for teams, this is probably ok.
I needed a quick to set up a tool that I can use to check the availability of several of my hobby projects and for that this is a great solution.
Better Uptime works great when managing on-call. We had previously used pager duty and switching to BU was a great step forward in terms of speed and quality of alerting.
There are some monitoring integrations missing. That could be improved.
Incident management on-call. Alerting the right team member when incidents happen.
Better Uptime is very good for incident management. We have an external uptime monitoring tool and integrate with Better Uptime. The calendar integration of on calls and custom escalations are amazing. It's easy but does all the things we need. We currently have 5 people on our team, and everyone is pleased with how we operate with the platform.
At this point, we only utilise the incident management part of the platform, and that works well, can't really judge the rest of the app.
We needed a reliable platform for managing alerts and Better Uptime is just that. It's intuitive and easy to use. Really recommend to any teams tired of bloated tools looking for a simple yet powerful solution.
Better Stack excels in providing a user-friendly interface, making it easy for both novices and seasoned users to navigate the platform. Implementing Better Stack may require some initial setup and configuration, but the process is generally smooth. The platform provides comprehensive documentation and support resources. Integrating Better Stack with existing tools and systems is generally straightforward. The platform supports a variety of third-party integrations, enabling users to connect their preferred apps seamlessly. However, expanding the range of supported integrations and enhancing the depth of existing ones could further improve the platform's versatility.
I don't have many complaints about Better Stack. If I were to highlight a couple of desired features for future updates, i'd appreciate more options for customization on status pages, particularly in terms of appearance (Custom themes ecc.). Additionally, it would be beneficial to have greater flexibility in manually adjusting the system status on the public status page, although the current limitations are not a significant issue but more of a preference for improvement.
Better Stack has helped me spot downtime immediately and manage the incident all while keeping the users informed thru the statuspage
Better Stack is an powerful and helpful tool to monitor server status and get alerts about any incidents, even on the basic plan. This tool offers many features and configuration options to always keep an eye on the server status. It can be decided independently which statuses should only be internally and which should be publicly visible. Along with the user-friendly interface and fast responding customer support this is really a great tool which is easy to implement and integrate.
Unfortunately, there are some minor restrictions on changing the status of a system on the public status page manually. However, this is nothing serious but rather a nice-to-have.
Better Stack immediately alerts the team in the event of unexpected incidents of a server so that you can act quickly.
Ease of use, comfort and efficiency, really easy!
There is a bug that you can't see logs from all times, only two days back.
Track common errors and crashes.
1. Seemless integration. 2. Easy navigation. 3. Short learning curve. 4. Ease of implementation. 5. Number of features. 6. Support is friendly and knowledgable. 7. Our main uptime platform as of now, and will continue to use this.
There is nothing that my team and I dislike about this platform.
Quick response to downtimes, we really appreciate the notifications.
The best thing would be that I get instant alerts about my websites downtime as soon as they happen.
Nothing yet, I'm pretty happy with better uptime.
My serverless website went down quite a lot. Better uptime gave me an option to fetch a log, get notification when the website was down, and to create an incident report and share it with the developer
Gives real-time updates for website, API, cronjobs and more. Simple and professional status page with filter option for every incident. Can also provide a Twitter page link for the website and update it automatically. Provide widget to stay updated
The app is awesome and i love it, but there is one thing that i think would make it better. They should have an option for push notifications so that we can take action instantly.
With better uptime, I can monitor network uptime for the server and website. It's not just about checking to see if a website is up, but helps us to get notified of any issues/incidents as soon as they arise.
Super easy to get started which I love. The fact that you can simply point it at a URL makes it really easy to use. The interface is really well done in my opinion as well.
Paid tiers are a little too steep for me at this time, but to be quite honest I don't really have anything critical in production to the extent that this tool is super relevant for it.
Sometimes I don't check my site for a while, and because I self-host it (for all kinds of reasons), it can potentially go down without me knowing it. It's useful to have someone looking out for me
The tool is straightforward to use. Simple to manage complex solutions. I have using BetterUptime for the last one month and have no trouble operating and maintaining,
In the trial version, at least enable mobile app alert.
Alternative to canary offered by AWS
The different services included, the design of the interface, the configuration options, the possibility to have an uptime page on your website
Nothing particularly so far, I'm doing some testing to use all the features at their best
I'm able to control the reliability of my website better and to show my users that we are always on
The UI is polished and usable. Pricing is a big advantage too.
The only thing I do not understand is why in "test" (create a fake incident) I get a call even if I do not have the option enabled for my monitoring services.
Better Uptime help me be alerted if one of my services is not running correctly.
It is great that they also monitor SSL certificates and that you can select for how long the system need to be down to trigger the alert. This avoids false alerts with short network issues. You can also select how long it has to be back up to automatically mark as resolved. That's great for continuous flakiness detection on recovery. You can also set certain GET/POST parameters to do a deeper check on some functions. You can send headers and bypass HTTP authentication. They can also integrate with some infrastructure monitoring tools. Phone calls, SMS, Slack notifications. They are working on POP, IMAP... and other monitors which are necessary for server, rather than just website monitoring.
The current notification setup just doesn't work well for me personally as it is right now. They only have on duty and whole team and you can't select different notifications and wait periods depending on the time of day. It seems designed for large companies that always have someone on call 24/7. If I want to get a call, SMS and e-mail during the day on certain monitors and just SMS and e-mail at night, then that's not possible. If I want to be notified after a minute of downtime during the day but only after 5 at night then that doesn't work out of the box. Some of these issues can be worked around with creative scheduling of users, but only on the Team plan and up.
In the long run I hope that it will replace our current monitoring.