

( 166 )
Better Stack Reviews: 4.8/5 — Highly Rated
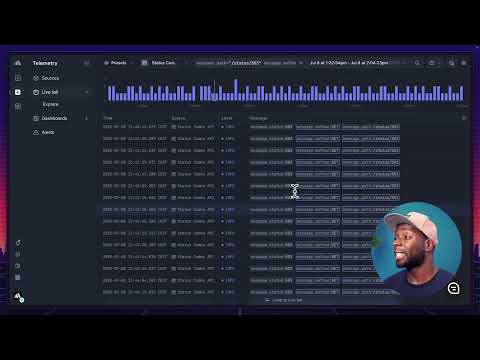
Better Stack lets you see inside any stack, debug any issue, and resolve any incident. Visualize your entire stack, aggregate all your logs into structured data, and query everything like a single database with SQL. Monitor everything from websites to servers. Schedule on-call rotations, get actionable alerts, and resolve incidents faster than ever. Made to fit into your workflow with over 100+ integrations.

| Capabilities |
API
CLI
|
|---|---|
| Segment |
Small Business
Mid Market
Freelancer
Enterprise
|
| Ease of use |
Beginner
Intermediate
Advanced
|
| Deployment | Cloud / SaaS / Web-Based, Mobile Android, Mobile iPad, Mobile iPhone |
| Support | 24/7 (Live rep), Chat, Email/Help Desk, FAQs/Forum, Knowledge Base, Phone Support |
| Training | Documentation, In Person, Live Online, Videos |
| Languages | English |


Perfect for small devs and their services, BetterStack is easy to set up and maintain, but there is no compromise on the amount of features you get.
I haven't found any reason not to use BetterStack
I can keep track of my server services without having to connect to my server, also is sending me reports on any incidents that may happen along the way. It keeps my website monitored so I can tempestively resolve incidents minimizing the downtime

I use Better Stack to monitor my web applications constantly. Better Stack keeps me updated with monitoring them and alerts me when there is a problem. It's super easy to use, and while I dread the "your site is down" emails, they are very helpful. I'm able to respond to outages quickly. Better Stack always has my back. I interact with the communication that they provide. For some of my apps, it sends me text messages and emails, which is extremely helpful. Better Stack allows me to acknowledge the incidents, which would be more helpful if I had a team around me. My company is just me, and seeing a Resolved email come through is fantastic. I haven't used customer support because the products stand so well on their own. It was super easy to implement monitoring, and now I don't even think about it. I'm very happy with their service. I haven't had to integrate it with systems other than my cell and email, but there are many options for integration beyond my needs. For usage of the site, I don't have to think about it since everything is working like a well-oiled machine. I interact with it when there is a problem, but most of the time, I don't actually need to go to their site as a solopreneur. The communication from them is superior to other options out there. I also use the site to set up new applications when I create them, but that isn't a daily occurrence.
Nothing that I can think of at this time.
Without Better Stack, I wouldn't have good coverage of my applications. It helps me monitor and alerts me of incidents with my web applications.
I love how simple it is to create a reliable web monitor. They offer the most robust and generous free tier I've ever seen, including free SMS notification!
For my needs, I've not yet come across anything I'd complain about.
I love their web monitoring and alerting capabilities. Easily as feature-rich as substantially more expensive solutions.
Loved the custom incident setup we could make, on top of the modern UI the tool is exactly what we were looking for.
nothing much to dislike, a while ago we would appreciate bulk action features, but saw they implemented that this week
it solved all our problems in terms of monitoring the website and alternating the right people at the time of an incident

Ease of use, features, and incident monitoring
I like the features and I don't have any dislike at the moment.
We use Betterstack to monitor our apps, and website, and also the incident reporting is helping us quickly jump and resolve any issues.
The elegant and very beautiful status pages, in addition to being able to use your own domain without paying, no service allows this, only Better Stack. The interface design is also very beautiful, in addition to the support being very efficient and always helping.
I have no criticisms, but it would be interesting to release new status page models, to vary some templates.
Better Stack helped me notify users when my service becomes unstable, down, and can display maintenance, as well as receive notifications when it goes down.
Cheaper and better than other tools on the market, quick with new features, ease of deployment and superb customer support.
After using Better Stack, my standards for user experience with devtools have raised exponentially.
We started using Better Stack for upsite monitoring but after some time we deployed for our whole log management.

Quality of everything - from UI/UX (User Interface and User Experience) to stable work and right set of tools to keep your servers and services up and running. It was very easy for me (amateur user of monitoring software) to set everything up and get it running. Unobtrusive and responsive customer support is always there if you need it. Good amount of educational materials, shall you want to dive deeper into the tool and technology. Also, from what I see in my admin panel, this is great tool for teams and bigger projects.
So far I had no single problem using Better Stack.
I use Better Stack primarily to monitor my website status and availability. The tool does its' work just right.
Better Stack keeps me informed and better prepared to take action.
I am unable to think of a single negative. The company updates their product often. They communicate often and they are enthusiastic about their oroduct.
Because my website is my business, any interruption is critical. Better Stack allows me to resolve issues the instant it occurs.

Ease of integration and easy to use. The integration was quick and features are good making daily life of a developer easy.
Dashboard can be a bit more catchy, otherwise it is nice.
Realtime alerts help me to be stress free as it alerts me whenever there is outage so that I can take action quickly.