
( 166 )
Better Stack Reviews: 4.8/5 — Highly Rated
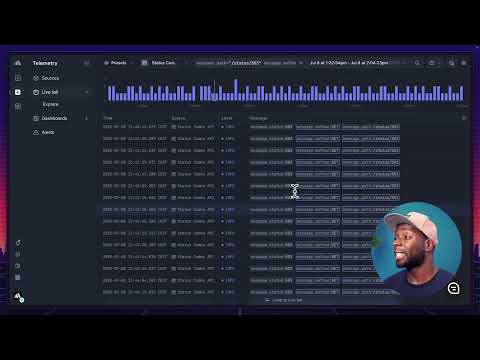
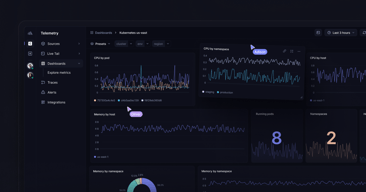
Better Stack lets you see inside any stack, debug any issue, and resolve any incident. Visualize your entire stack, aggregate all your logs into structured data, and query everything like a single database with SQL. Monitor everything from websites to servers. Schedule on-call rotations, get actionable alerts, and resolve incidents faster than ever. Made to fit into your workflow with over 100+ integrations.


| Capabilities |
API
CLI
|
|---|---|
| Segment |
Small Business
Mid Market
Freelancer
Enterprise
|
| Ease of use |
Beginner
Intermediate
Advanced
|
| Deployment | Cloud / SaaS / Web-Based, Mobile Android, Mobile iPad, Mobile iPhone |
| Support | 24/7 (Live rep), Chat, Email/Help Desk, FAQs/Forum, Knowledge Base, Phone Support |
| Training | Documentation, In Person, Live Online, Videos |
| Languages | English |

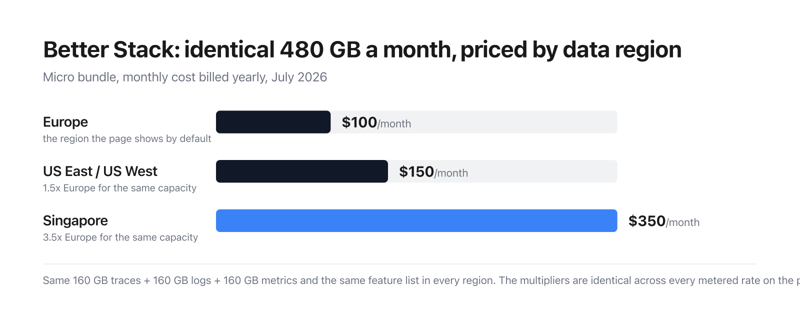
Better Stack’s Micro bundle costs $100 a month in Europe, $150 in the United States and $350 in Singapore — for exactly the same 480 GB and exactly the same feature list. Every metered rate on the page carries the same multipliers: US is 1.5× Europe, Singapore is 3.5×. The page opens on Europe, the cheapest of the four. Choosing where your data lives is the single largest decision on Better Stack’s price list, and it is made by a dropdown most buyers will scroll straight past.
- What it is: A combined observability and incident-management platform — logs, metrics, traces, errors, uptime monitoring, on-call and status pages.
- Best for: Teams that can host in Europe and want one vendor instead of five.
- Pricing: Free tier, then $29 per responder per month billed yearly. Telemetry billed separately. Verified July 2026.
- The honest catch: The platform costs $29; a fully-equipped status page costs $886.
What Is Better Stack?
Better Stack bundles a set of products usually bought separately: log and trace aggregation queryable with SQL, PromQL or a drag-and-drop builder, metrics, error tracking, session replay, web events, uptime and Playwright transaction monitoring, cron heartbeats, on-call scheduling, incident management inside Slack or Teams, branded status pages, and a Slack-native AI SRE agent that investigates incidents against your telemetry.
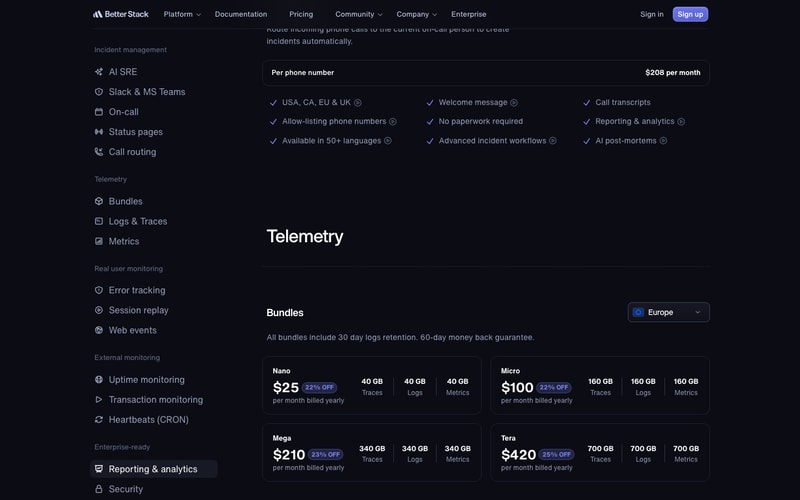
Pricing is à la carte rather than tiered. There is one licence price and a long list of separately metered components.
How Better Stack Works
- One responder licence, then metered add-ons.
- Team members are free; responders are not.
- Telemetry is billed by volume, in bundles or pay-as-you-go.
- Data region multiplies every rate.
- Status-page features are the costliest add-ons.
- 60-day money-back guarantee.
Better Stack Pricing
Captured from Better Stack’s pricing page in July 2026 in US dollars, reading both billing toggles and all four data regions.
| Component | Monthly | Billed yearly | Unit |
|---|---|---|---|
| Free tier | $0 | $0 | 10 monitors, 1 status page, 100k exceptions, 5,000 replays |
| Responder licence | $34 | $29 | per licence per month |
| Team members | $0 | $0 | unlimited |
| Slack channel/thread workflows | $9 | $9 | per responder licence per month |
| Reporting & analytics | $5 | $4 | per member per month |
| Additional 50 monitors | $25 | $21 | per month |
| Additional 10 heartbeats | $20 | $17 | per month |
| SSO with Azure or Okta | $5 | $5 | per user per month |
| Audit logs | $250 | $208 | per month |
| Call routing | $250 | $208 | per phone number per month |
| Telemetry bundle | Europe | US East/West | Singapore | Capacity |
|---|---|---|---|---|
| Nano | $25 | $38 | $88 | 40 GB each of traces, logs, metrics |
| Micro | $100 | $150 | $350 | 160 GB each |
| Mega | $210 | $315 | $735 | 340 GB each |
| Tera | $420 | $630 | $1,470 | 700 GB each |
| Multiplier | 1.0× | 1.5× | 3.5× | identical features |
What actually decides your cost:
- Data residency is the biggest multiplier on the page, and it is exact. Europe is the baseline. US East and US West both cost 1.5×. Singapore costs 3.5×. This is not approximate: logs ingestion runs $0.10, $0.15 and $0.35 per GB; metrics retention $0.50, $0.75 and $1.75 per GB per month; error tracking $0.000050, $0.000075 and $0.000175 per exception; session replay $0.00150, $0.00225 and $0.00525 each. Every one is precisely 1.5× and 3.5× the European rate, with only the logs retention figure rounded for display. The capacity and the feature list are identical in all four regions. If your compliance position lets you host in Europe, that choice is worth more than every discount on the page combined.
- The comparison claims do not move with the region, though the prices do. Beside the error-tracking rate the page reads “approx. 6x cheaper than Sentry”, and the section is headed “Sentry-compatible at 1/6th the price.” That text is byte-for-byte identical whether the rate showing is $0.000050 (Europe) or $0.000175 (Singapore) — a spread of 3.5×. The same is true of “up to 2x cheaper than PostHog” on session replay and “At 1/10 of the cost of PostHog or Amplitude” on web events. Whatever the comparison is worth in Europe, it cannot hold equally in Singapore at three and a half times the price.
- The discount badges are honest, and they are off the pay-as-you-go rate — not off each other. Each bundle shows two percentages, and both reconcile exactly against the metered rates published further down the same page. Nano’s 40 GB of logs, traces and metrics costs $32 a month at European pay-as-you-go rates ($6 logs, $6 traces, $20 metrics); the bundle is $30 monthly, 6.25% off — badged “6% OFF” — and $25 yearly, 21.9% off, badged “22% OFF”. The same arithmetic lands on 8%/23% for Mega and 11%/25% for Tera. Verifiable discount claims are rare enough to be worth saying out loud.
- Metrics are 62.5% of every telemetry bill while being a third of the data. Metrics retention costs $0.50 per GB per month against $0.15 all-in for logs — 3.3×. Because the bundles allocate equal gigabytes to traces, logs and metrics, metrics account for exactly 62.5% of the pay-as-you-go equivalent of all four bundles. If you are choosing a bundle size, model your metrics volume first; the logs figure that gives the bundle its name is the cheap third.
- The platform costs $29; the status page costs up to $886. One status page is included, but its options are priced per page per month at yearly rates: white-labelling $208, IP allowlisting $208, single sign-on $208, sending e-mail from your own domain $208, password authentication $42 and custom CSS/JavaScript $12. A single fully-equipped status page therefore runs $886 a month — over 30 times a responder licence, and $1,065 if billed monthly. For a company that wants a branded status page without Better Stack’s footer on it, that one line will dominate the invoice.
- “Unlimited team members” is true until you want reporting. Members are explicitly $0 per member per month, which is genuinely generous next to the per-seat norm in this category. But Reporting & analytics is charged per member, not per responder — $4 each billed yearly. A forty-person engineering organisation with three responders pays $87 for licences and $160 for reporting: the reporting add-on costs nearly twice the platform. Azure and Okta SSO are also per user at $5, while Google SSO is free.
- Heartbeats cost four times what monitors cost. Extra monitors are $21 per 50 (42¢ each); extra heartbeats are $17 per 10 ($1.70 each) — a 4× difference per unit for what is, from outside, a simpler check. Ten of each are included free.
Who Should Use Better Stack
- Teams consolidating five tools into one. The clearest case — logs, metrics, errors, uptime, on-call and status pages under one bill.
- Anyone who can host data in Europe. The same platform at a third of the Singapore price.
- Small teams and side projects. The free tier is unusually complete: 10 monitors, a status page, 100,000 exceptions and 5,000 session replays a month.
- Organisations with many observers and few responders. Free unlimited members is worth real money at scale.
It fits poorly for teams needing Singapore or US data residency on a tight budget; for anyone whose status page must be white-labelled and access-controlled; for metrics-heavy workloads; and for HIPAA-regulated organisations, which Better Stack says outright it cannot serve.
Honest Pros and Cons
Strengths
- A genuinely usable free tier, not a trial.
- Unlimited team members at $0.
- Discount badges that reconcile exactly with the published rates.
- 60-day money-back guarantee — twice the usual 30.
- SOC 2 Type 2, ISO 27001, GDPR, EU storage by default.
- Says plainly it is not HIPAA compliant rather than staying quiet.
Limitations
- Singapore costs 3.5× Europe for identical capacity.
- Comparison claims stay fixed while prices vary 3.5×.
- $208 per page per month for white-labelling, SSO and IP allowlisting.
- Reporting is billed per member, undercutting free seats.
- Metrics are 62.5% of every bundle’s underlying cost.
- Extra heartbeats cost 4× extra monitors, per unit.
Better Stack Alternatives and How It Compares
- Datadog is the full-coverage incumbent Better Stack’s own footer benchmarks against.
- Sentry is the error-tracking standard, and the target of the “1/6th the price” claim.
- PostHog covers session replay and product analytics, named in two claims on the page.
- Grafana Cloud is the closest open-source-rooted alternative for logs and metrics.
- PagerDuty competes specifically on on-call and incident response.
The Verdict
Better Stack is doing something unusual, and mostly doing it well. Rather than a three-tier ladder, it publishes one $29 responder licence and then meters everything else openly — a free tier that is genuinely usable, unlimited team members at no cost, and telemetry priced by the gigabyte with bundles on top. The discount badges even survive checking: Nano’s “6% OFF” and “22% OFF” reconcile to 6.25% and 21.9% against the pay-as-you-go rates published further down the same page, and the same arithmetic holds for all four bundles. Vendors whose percentages can be audited from their own price list are a minority.
The thing to understand before comparing Better Stack with anything else is that the data-region dropdown is the most expensive control on the page. Europe is the baseline; US East and US West cost exactly 1.5×; Singapore costs exactly 3.5× — and that multiplier applies to every metered rate, not just the bundles. The Micro bundle is $100, $150 or $350 a month for the identical 480 GB and the identical feature list. The page opens on Europe, the cheapest of the four, so the figure a casual reader takes away is the best case. Anyone with a compliance requirement pinning data to Singapore should re-price the whole platform before drawing conclusions.
That regional spread also strains the comparative marketing. “Approx. 6x cheaper than Sentry” sits beside the error-tracking rate in every region, unchanged, while that rate ranges from $0.000050 to $0.000175 per exception. The same static claims accompany session replay (“up to 2x cheaper than PostHog”) and web events (“1/10 of the cost of PostHog or Amplitude”). These are not false so much as unqualified: they can only describe one region at a time, and the page never says which.
Two more numbers deserve a place in any budget. Metrics retention costs 3.3× what logs cost per gigabyte, which means metrics are 62.5% of the underlying cost of every bundle despite being a third of the data — so size your bundle on metrics, not logs. And the status-page add-ons are the steepest line on the page: white-labelling, SSO, IP allowlisting and custom-domain e-mail are $208 per page per month each, so a fully-equipped status page reaches $886 a month, more than thirty times a responder licence. Host in Europe, watch your metrics volume, and decide early whether that status page really needs to be unbranded.
FAQ
How much does Better Stack cost?
There is a free tier, then $34 per responder per month monthly or $29 billed yearly. Team members are unlimited and free. Telemetry is billed separately, either pay-as-you-go or in bundles from $25 to $420 a month on European rates. Add-ons — extra monitors, heartbeats, status-page features, reporting, audit logs — are metered individually. A 60-day money-back guarantee applies.
Why does Better Stack’s price change when I pick a different data region?
Because the region multiplies every metered rate. Europe is the baseline, US East and US West cost 1.5×, and Singapore costs 3.5× — for identical capacity and an identical feature list. Logs run $0.10, $0.15 and $0.35 per GB; metrics retention $0.50, $0.75 and $1.75 per GB per month. The page opens on Europe, so the prices shown by default are the lowest available.
Is Better Stack really six times cheaper than Sentry?
That is Better Stack’s claim, printed beside its error-tracking rate — but the claim never changes while the rate does. It appears identically at $0.000050 per exception in Europe and $0.000175 in Singapore, a 3.5× spread. Whatever ratio holds in one region cannot hold in all of them, and the page does not say which region the comparison refers to.
Is Better Stack’s free plan actually usable?
More than most. It covers 10 monitors and heartbeats, one status page, 100,000 exceptions a month, 5,000 session replays, 3 GB each of logs, traces and web events retained for three days, and 30 GB of metrics — with Slack and e-mail alerts. It is labelled “free for personal projects”, and the three-day retention is the main constraint for anything production-facing.
What does a branded status page cost on Better Stack?
One status page is included with a licence, but the options are charged per page per month at yearly rates: white-labelling to remove the “Powered by Better Stack” footer is $208, as are single sign-on, IP allowlisting and sending e-mail from your own domain. Password authentication is $42 and custom CSS/JavaScript $12. A page with all of them costs $886 a month, against $29 for the responder licence itself.

I like that the interface is simple and that uptime has a free plan for freelancers and small businesses who wants to make sure that their site is up and running.
Nothing until now, I checked a few solutions, and I ended up trying out Better Uptime. Even though I have a good host, it is nice to ensure that my site is up if I change to a less stable provider. Had I known about BetterUptime some months ago, I would have saved quite a few bucks on hosting because then I could have sent the uptime reports along to the cheap hosting company.
I make sure that my provider delivers what I am paying for and since uptime is precious. Better uptime provides a simple tool to monitor it. Since my business is not relying heavily on my website, it is nice with a free plan, but for large sites, it is a no-brainer.
The status pages are really nice, like really nice - probably my favourite part about the entire experience. 30 second checks are also really good. Server Agents would be a nice addition!
Not being able to modify the actual UI of the status pages, for example colours to match the colour scheme of the actual business. Other than this, the experience and panel is amazing.
Status pages at a more affordable price, the call scheduling is also very handy to automatically rotate people who are on call without having to do anything from a manual perspective.

I have already tried several uptime monitor services, but in the end Better Uptime convinced me the most! The price-performance ratio is extremely good and I would say that Better Uptime is also suitable for non-technical users, as it is very easy to use. The dashboard is clear and yet offers a lot of settings. Setting up a new monitor is very easy and can be customized for each website to be monitored. I hope for many more years of using Better Uptime.
I would like to see Better Uptime, or at least the Status Pages, available in other languages. Unfortunately, everything is currently only in English. In the backend okay, but for international customers a translated status page would also be very desirable.
I monitor all my clients' websites so that I am informed if they are ever unavailable. It is very unpleasant when the customer before you notices that something is not working. And this is where Better Uptime really works reliably. In case of outages, I'm immediately informed by email as well as by push notification on my smartphone to have a look at what's going wrong. At the same time, Better Uptime also provides some info on what exactly is going wrong, so that troubleshooting is more targeted.
Everything worked as expected. Intuitive user interface, beautiful status page, frequent check interval, affordable (free!), Slack integration for alerting. It literally does everything I need it to do, and it does it extremely well.
Nothing, maybe some better support around customizing the status page to fit in my site's dark theme without having to muck with CSS. Truthfully I haven't tried customizing the page yet since the default is already beautiful.
Uptime monitoring all my company's website and API server
Super-fast setup and receive instant value. The status page works like a charm. We start receiving useful information in no time.
Nothing at the moment. It's very clear to config. Really easy.
We need a status page for our service, to show hows the service is. Also, really fast feedback if the platform has come problem.
Easy & quick setup and after a minute you can start monitoring your domain. Easy to navigate thanks to the great UX design. Push notifications do a great job as soon as the domain has delivery issue. An absolutely mandatory application that will help any web store / site owner or administrator. Top recommended!
Absolutely nothing to complain about, it works perfectly as it should.
If the outage is longer or often at the same time, contact the service provider or I can temporarily pause ads to stop unnecessary payment clicks.
Quick and easy platform to use. Even using the basic level lets me set up good monitors and beautiful dashboards. Often you have to select 2 out of 3, but here you get it all. Good service, Great price (free?), and easy to set up.
I would love it if there were dark mode available. But for the price, I can't complain.
Getting fast notifications on when there are issues for APIs or ISPs. Sending reports to users with relevant information.
Beautiful UI, clean and straightforward steps. Free custom domain status page and free SSL cert issue monitor, them even can offer domain expire monitor! As a personal web developer, I can't afford the expensive service like "Atlassian status page", and self-host opensource service is not very reliable. so when i found the betterUptime, i realize this is everything i want.
Register step takes a little time. but it's okay.
It's helped monitor website online status and find an issue of SSL cert. I thought it was configured rightly, but no.

A mature tool. You can configure a lot of stuff to get your notifications as you please. The user interface is legendary.
I like everything about BetterUptime. No dislikes.
I always know then my web pages are down. Even if its just for a few seconds.
As a busy digital agency monitoring over 100 client websites, we could not do without Better Uptime. We are able to test outages against the server endpoints, the DNS and the development/ staging instances in order to eliminate false positives and narrow down causes.
There is really nothing to dislike about the service/ software.
Checking AWS and other hosting providers, being able to accurately report to clients on points of failure (if any).
It offer all the tools you need to manage your website status and keep your members notified in what's happening
The mobile apps can improve more such as showing the dashboard inside the app not opening external link
Keeps my costumers notified with any maintenance going on our website
I love the clean design of their status pages, and You can even post updates to let your customers know about ongoing incidents.
It will be nice if they could collect metrics from say "prometheus" to make the monitoring complete.
I easily notify my clients when there is an incident and provide them updates as I resolve the incidents. Better Uptime also gives me peace of mind that my cron jobs like DB backup are executing successfully daily since it is being monitored.

The interface is user-friendly, and the status landing page is easy to understand. In that way gives valuable tools to our company.
Until now there was nothing to dislike as the service works as it should.
I can easily monitor my servers and, at the same time, act when something is wrong.

Great sevice, reliable, with superb options.
Nothing at all. Really a great service overall
Website availability, connection issues, timeout errors
Better Uptime has really nice UI both on the backend admin side and the frontend status page side. My users really enjoy the auto incidents so they can know when one of my services is down that effects them.
Nothing much so far. All the features have been exceptional.
Being able to monitor services that effect my users if they go down.
Extremely easy to setup, navigate, and implement. Took less than 15 minutes.
I have yet to run into anything I dislike about it.
We use BU to monitor on-site FTP Services, Cloud, and Websites.
Good detail dashboard. Free custom status page.
Honestly, nothing. But need more functions on the mobile app
I can keep an eye on all my websites with this tool
We use Better Uptime across a few accounts and clients. It's helped us keep on top of our infrastrutcutre and has allowed our partners to notify us of issues and ensure platform transparency.
We have none - I hope they continue to support and enhance Better Uptime with many more features in the future.
Clients tend to like to know how their services are performing - especially SMBs. Better Uptime allows us to create custom status pages for them to ensure peace of mind. For our enterprise-level clients, we've enhanced the method of communicating issues and planned maintenance to ensure we meet SLAs. We have received positive feedback from project managers and developers about how effective and easy it has been to be kept in the loop.
Simple but powerful Beautiful design Great app
Nothing Everything works great Great service
Keep an eye to all my servers status Notify my users about my services status
Better Uptime does exactly what it says on the box. It gives you detailed uptime stats and alerts for multiple domains with very little setup required. If you need uptime monitoring, this is the product!
This is a rare case where there simply isn't anything to dislike. The product works exactly as expected.
Tracking uptime across multiple domains with instant alerts if there are issues.
I like how easy it is to set up and start using, and it takes only a few minutes to get up and running per website. Status pages look very professional with my company logo, and they are easy to understand for my clients. When using status pages, my clients can subscribe to the uptime monitor and get notifications when the website is down and back online again, which is great.
Nothing, but I would love to see integration with MainWP.
I can monitor all my own and client's websites. This is a great way to see how well or bad different hosting companies perform, and I have already moved several websites away from bad hosting. It is very easy to convince clients to move to another hosting company, when I can show uptime statistics for the past 30 - 365 days.

1. Voice notifications — nothing beats a ringing phone that one has to pick up and press a button to acknowledge an alert. Much more difficult to overlook than an SMS or a push alert. 2. Heartbeats — the possibilities to use this feature to control various processes that need to execute on a schedule are huge.
After 9 months of use I really don't have anything to dislike about this product. If I have to be really, really picky — perhaps their mobile app is a bit of a letdown as it doesn't replicate the full functionality of the web dashboard but redirects towards it (for example, to see the details of an alert). Because I have 2FA enabled on my account, there are several additional operations that I need to perform to see what happened during an alert.
BU helps me keep track of my website uptime and holds me honest towards 3rd parties who are using — or consider using — my hosting services. Also, the Heartbeat feature allows me to be sure that my servers perform as they should and that backups are made regularly.
The content monitor is great to check that the site is always still displaying the text it's supposed to. Had it been defaced it would most likely be missing. :)
Nothing I can think of off the top of my head..
I rely on it to always check that the sites I manage are online and working so I know before my customers know if something is not working correctly.
Have used many monitoring tools in the past however love just how easy better uptime is to use and setup. We absolutely love Better Uptime and can't recommend it enough!
Whilst there is a grouping feature for the monitors and heartbeats it does require you to drag them to the bottom of the screen to create a new group. We would like to see the following: 1. Sort by group name for entire screen as it can get pretty messy when you have 100's of groups on one screen. 2. Sort each group by name so that each heartbeat and monitor is sorted in each group 3. Create a group without having to drag a monitor or heartbeat to the bottom. This is needed especially when you start creating thousands of groups and monitors.
Allows us to detect expiring SSL certificates. We also use it to monitor uptime of servers and network devices.
This is one of the coolest tools on our stack! Definitely, a most needed tool to keep track of uptime, incidents, and real-time alerts. Realtime and multi-location monitoring make to avoid any kind of false-positive alerts. The phone call-based alerts make our incident escalation process faster. The BetterUptime not just monitors the server uptime but also specific ports, SSL expiry, domain expiry, website content changes, and it makes it another level of product. Betteruptime makes life easier!
Just wish to have some comprehensive mobile application with detailed alerts overview. Other than that so far, so good! We haven't deployed for our complete infrastructure yet! But it performs best on whatever we have added till now. So, no complaints! No dislikes!
Uptime monitoring and alerts. Monitoring our client sites, SSL and domain name. The call based incedent alerts making this a really out of the box application. This enables us to faster escalation for all any downtimes or errors within the system.

- The UX and UI are modern, clean, and easy to navigate. - Monitoring API access. Webhooks. - Great range of integration, in particular: the import data option & infrastructure monitoring (Zabbix, New Relic, Datadog, Grafana, Azure, ...) - 30s checks, insane value - phone & email alerts
Honestly, nothing. I got few false positives but easy to track down. Great service.
Checking uptime and be sure to never miss an incident. Mission accomplished here with Better Uptime.

It works 100% of the time. Sites go down, I know immediately. On desired URL's, I get a phone call. Weekly reports let me know how my clients were handled and I highly recommend the app. I've tried many, none are better!!!
All works perfectly. I have no recommendations. BetterUptime is a solid performer.
N/A

Better uptime is one of the most popular monitoring software also has many features like jit incident tracking, heartbeat, lots of integrations and more...
Not just yet, couldn't find any of dislike in it
Me and my team tracks whole operations with less incidents

The accuracy of notifications when some of my servers or services are down.
No possibility for other languages then English for the status pages
I know it almost immediately when a client their website or server is down.

Better Uptime provides a very well put-together interface to add monitors and alarms for services running at home, in the cloud, or elsewhere. I've been using it for about 6 months and it's been highly reliable and notifying me that my things are down, and when they come back up. It's been a game changer and keeping my SLAs.
This product is great! The only problem I've run into is that webhooks aren't free. If you're using this product to "make money" then that's probably not a big deal. I use it for free open source software and services, so I didn't want to pay (sorry, I'm a bit cheap). The company was nice enough to give me webhooks for free when I asked for them. I couldn't have asked for more, and that feature being enabled has allowed me to maintain SLAs on my (also free) services. I connected Better Uptime to Notifiarr.com so I can get custom notifications in Discord. It works beautifully.
Better Uptimes tells me very quickly when my services are down. It allows me to react and correct the problems before my users notice.