

Unclaimed: Are you working at Amplitude Analytics?
Amplitude Analytics Reviews: 4.5/5 — Highly Rated
Amplitude is an analytics tool designed to support businesses by helping them understand user behavior and giving them key insights that can help them improve their products. It offers tools such as behavior tracking, funnel analysis, as well as A/B testing that combines to help companies make data-driven decisions that optimize products and drive business growth.

| Capabilities |
AI
API
|
|---|---|
| Segment |
Small Business
Mid Market
Enterprise
|
| Deployment | Cloud / SaaS / Web-Based, Mobile Android, Mobile iPad, Mobile iPhone |
| Training | Documentation |
| Languages | English |



Amplitude gives you 2 million events a month free forever, and then prices on events rather than users, which is the detail that catches people out. Event volume grows with the number of things your product does, not with how many customers you have. Teams routinely discover that shipping features, not acquiring users, is what moves them into a procurement conversation.
- What it is: A product analytics platform for understanding user behaviour, with cohorts, funnels, session replay, and experimentation.
- Best for: Product teams at companies with a dedicated analyst or the appetite to build one, tracking behaviour rather than page views.
- Pricing: Free for 2M events/month. Plus starts at $0 and scales to 70M events. Growth and Enterprise are custom, event-based. Verified in July 2026.
- The honest catch: Growth and Enterprise have no published pricing at all, and reviewers report Amplitude costing two to five times Mixpanel at equivalent usage.
What Is Amplitude?
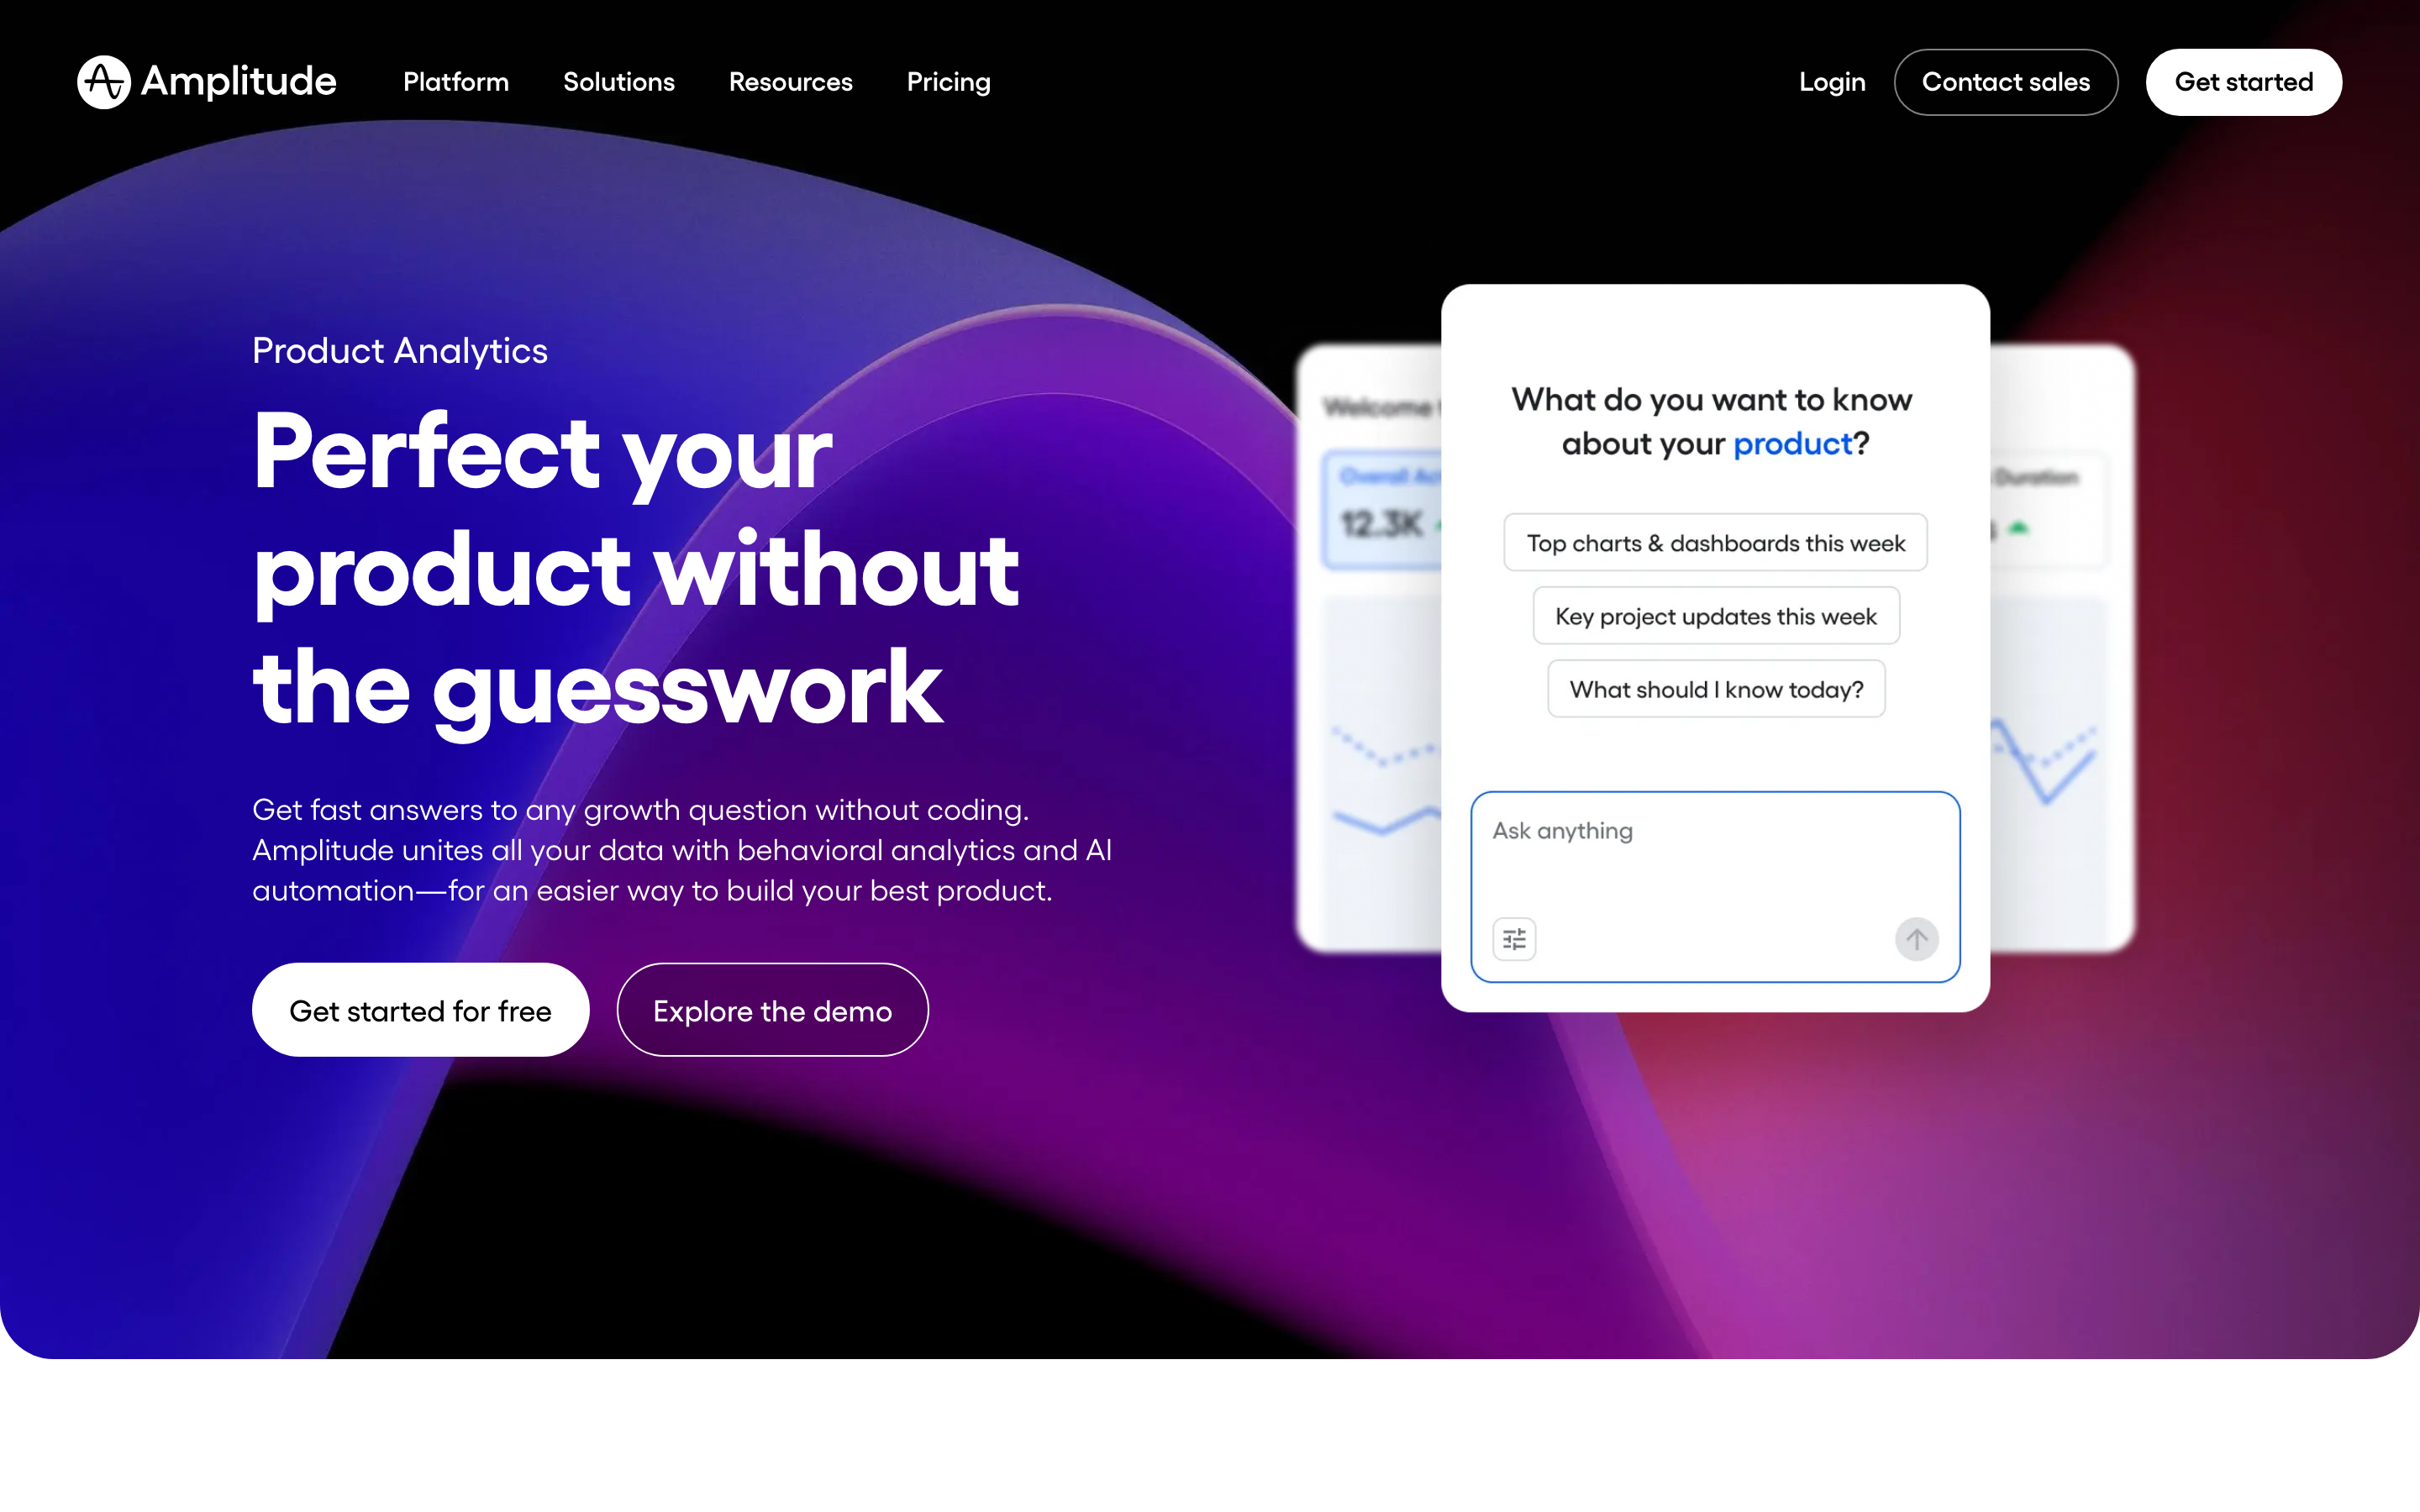
Amplitude is a behavioural analytics platform, which is a meaningfully different thing from web analytics. Google Analytics tells you how many people visited a page. Amplitude tells you which sequence of actions preceded a conversion, which cohort of users retained after a feature launch, and where in a multi-step flow people abandon.
The customer list reflects the seriousness of the tooling: Atlassian, Square, Zoom, Qualtrics, and Gong all appear on its pricing page. This is a product built for teams that treat product decisions as analytical questions.
In 2026 Amplitude has added AI Agents with Model Context Protocol support, session replay, and, like several other products in this catalogue, AI Visibility prompt tracking. That last addition is notable: Semrush, Surfer, Writesonic, and now Amplitude have all built AI-search visibility into products that previously had nothing to do with it.
The independent rating is good on a modest sample, at roughly 4.6 out of 5 on Capterra across 67 reviews.
How Amplitude Works
- Event-based tracking. Every user action, a click, a page view, a signup, a purchase, is an event. This is the billing unit and the analytical unit.
- Cohorts and retention. Behavioural cohorts, retention curves, and funnel analysis are the core, and where Amplitude clearly beats general web analytics.
- Session replay. 10,000 monthly replays even on free, rising to 50,000 on Enterprise.
- Experiments, guides, and surveys. Included in limited form on free, expanding with tier.
- AI Agents and MCP. Available on every plan including free, letting AI assistants query your analytics directly.
- Governance. SSO and project permissions on Growth, data access controls and RBAC on Enterprise.
Amplitude Pricing
Four tiers, two of them unpriced. Figures verified on Amplitude’s pricing page in July 2026.
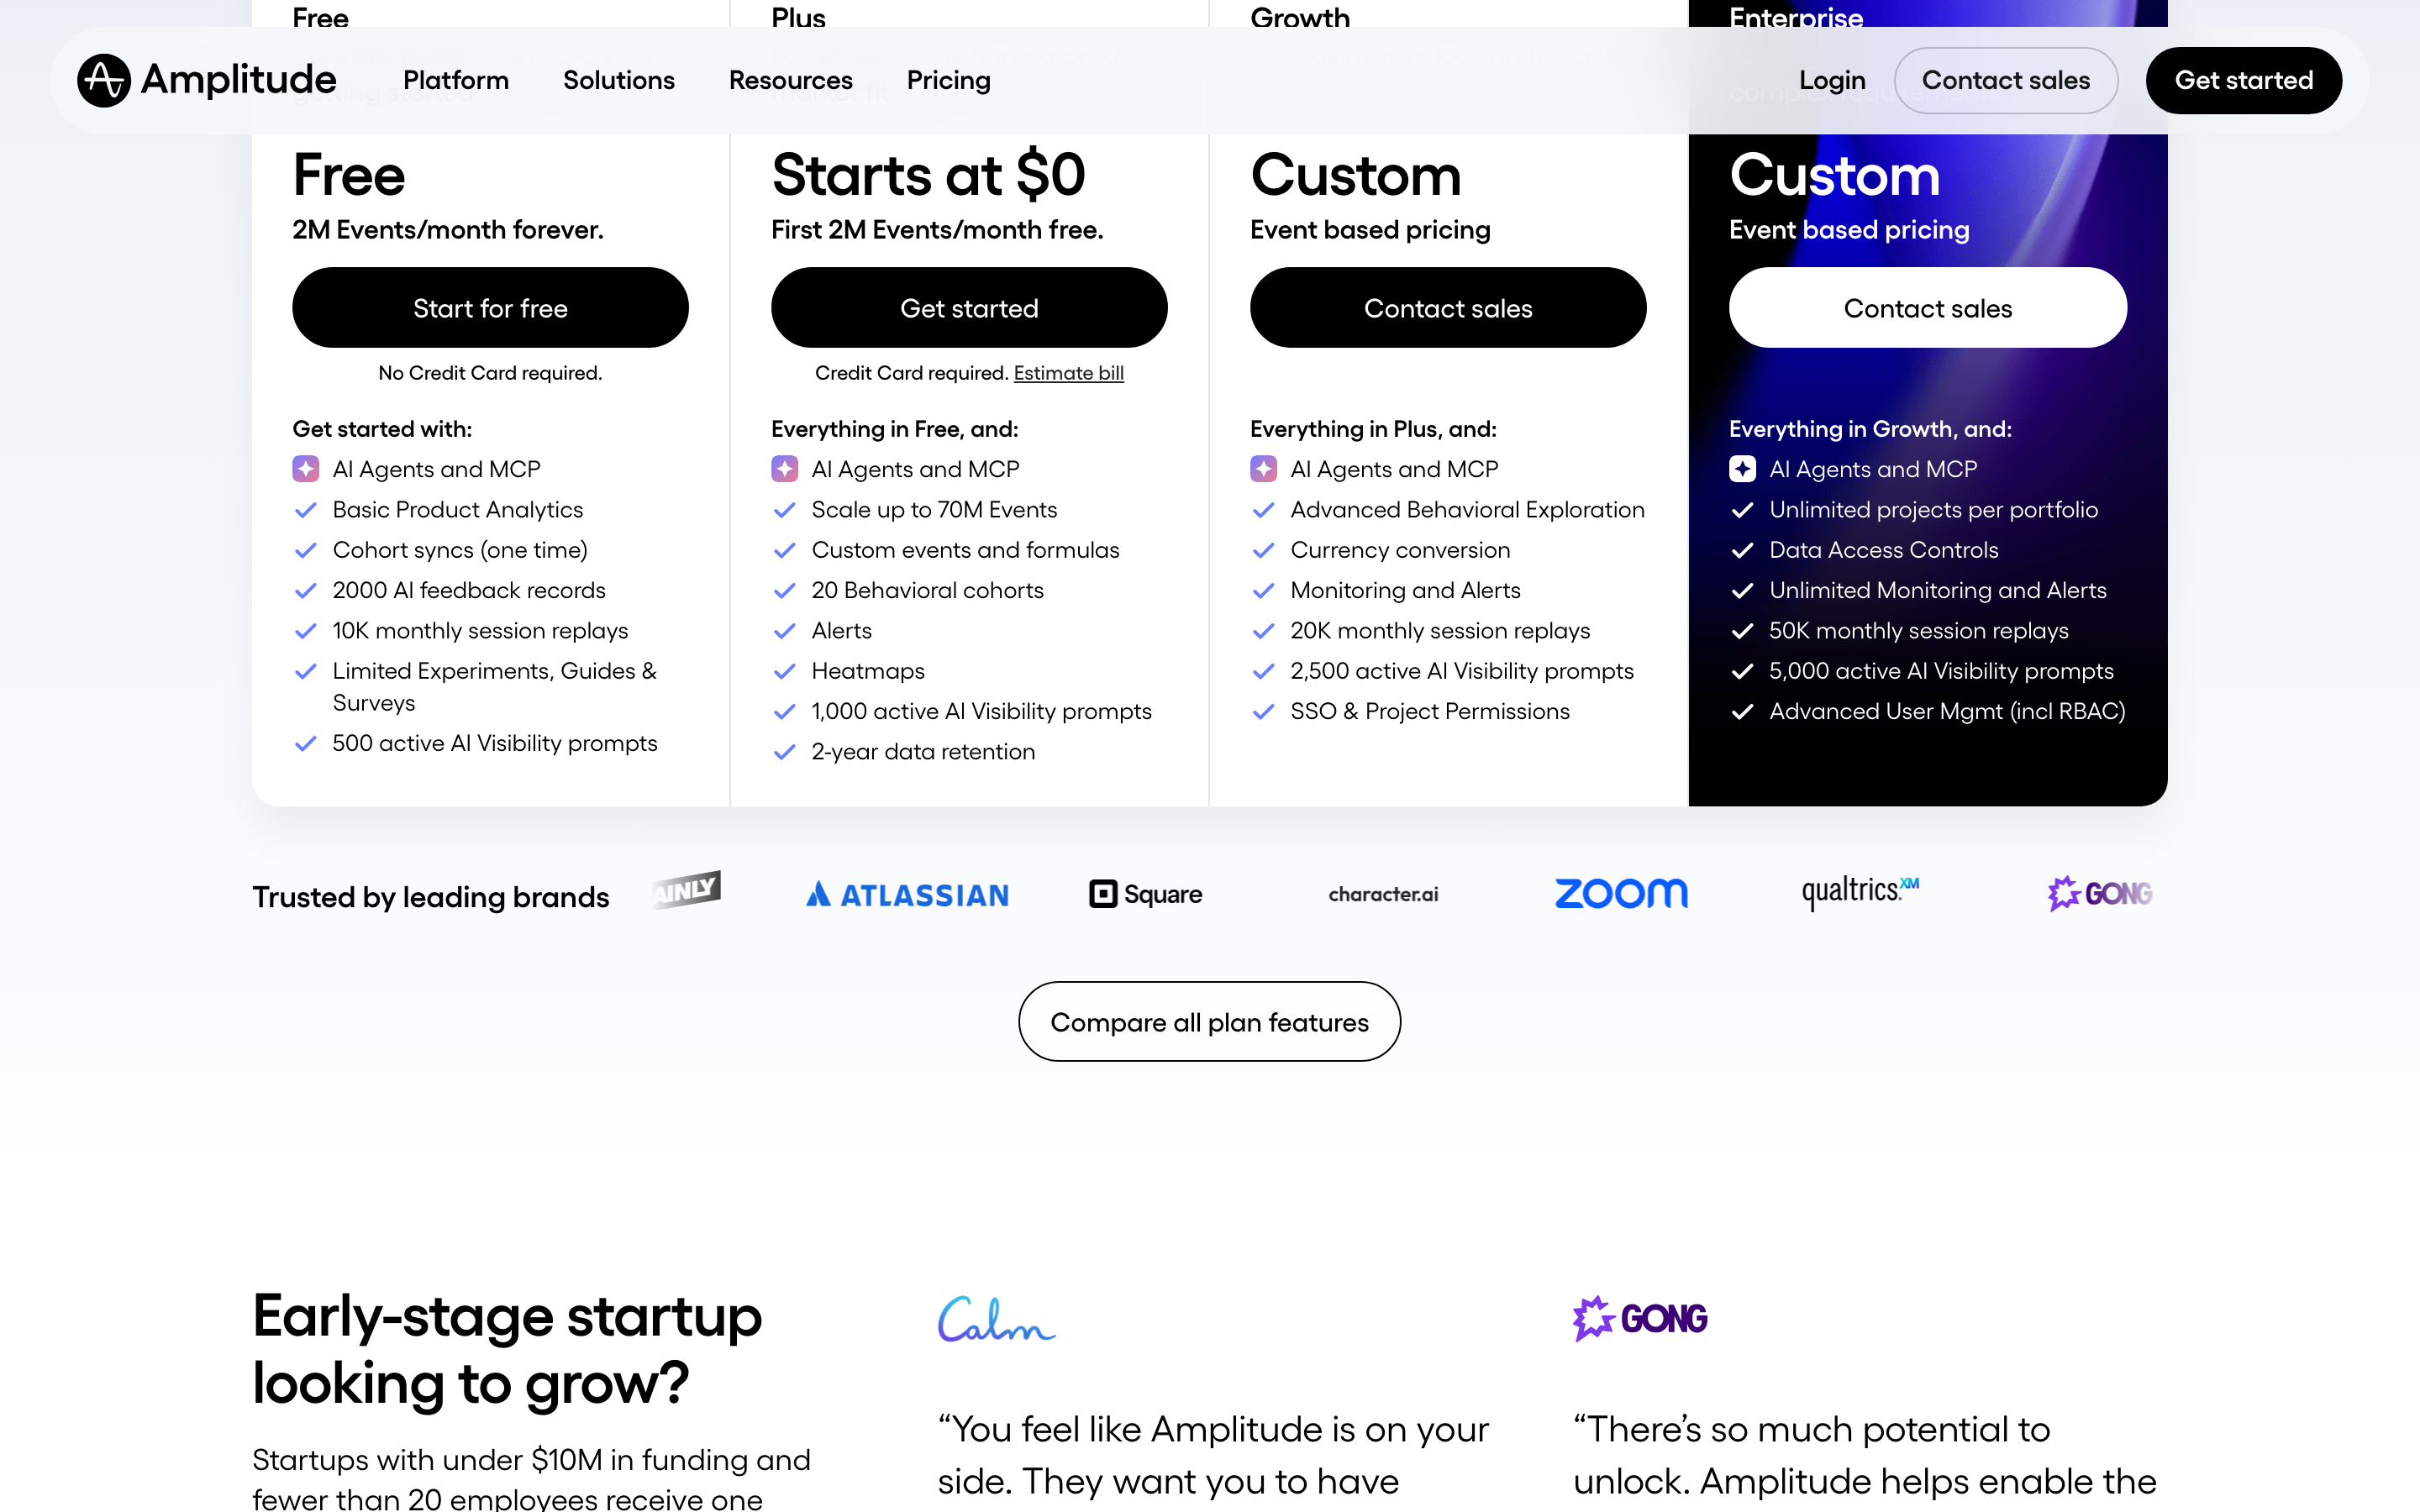
| Plan | Price | Events/month | Session replays | Notable |
|---|---|---|---|---|
| Free | $0 forever | 2M | 10,000 | AI Agents and MCP, basic analytics, 500 AI Visibility prompts, no card required |
| Plus | Starts at $0 | Up to 70M | 10,000 | Custom events and formulas, 20 behavioural cohorts, alerts, heatmaps, 2-year retention. Card required |
| Growth | Custom | Event-based | 20,000 | Advanced behavioural exploration, monitoring, SSO and project permissions |
| Enterprise | Custom | Event-based | 50,000 | Unlimited projects, data access controls, RBAC |
What determines what you pay:
- Events are not users. One person in one session can generate dozens of events. A product that ships more instrumented features generates more events from the same audience, which is why reviewers describe cost rising faster than headcount or revenue. This is the single most important thing to internalize.
- 2 million free events is genuinely generous. For an early-stage product it can last a long time, and it is a real free tier rather than a trial.
- Plus “starts at $0” is usage pricing, not a free plan. The first 2M events are free, a credit card is required, and beyond that you pay by volume. Amplitude provides a bill estimator, which is worth using rather than guessing.
- Growth and Enterprise are unpriced. Reviewers specifically note that opaque pricing at those tiers forces sales conversations smaller teams would rather avoid.
- Cost at scale is the dominant complaint. Reviewers across multiple platforms report Amplitude costing two to five times Mixpanel for equivalent usage.
- The startup scholarship is worth knowing about. Companies with under $10M in funding and fewer than 20 employees can get a free year of the Growth plan, which is a substantial offer and not widely publicized.
Who Should Use Amplitude
- Product teams making behavioural decisions. The clearest case. Retention analysis, cohort behaviour, and funnel diagnosis are what this tool is for.
- Early-stage products. 2M free events plus the startup scholarship makes Amplitude close to free for a company that qualifies.
- Teams with analytical capacity. Reviewers consistently report a two-to-four-week ramp, so this rewards teams with someone who owns analytics.
- Companies already instrumented for events. If your product emits structured events, Amplitude turns them into answers quickly.
It fits poorly for teams wanting simple traffic reporting, where Google Analytics or Plausible cost nothing and answer the question, for organizations needing predictable budgets, given usage-based pricing on an unpredictable meter, and for teams without an analyst, since the learning curve is real.
Honest Pros and Cons
Strengths
- A genuinely generous free tier. 2 million events a month forever, with no card, including session replay and AI agents.
- Best-in-class behavioural analysis. Cohorts, retention, and funnels handled better than in general analytics tools.
- The startup scholarship. A free year of Growth for qualifying early-stage companies is a serious offer.
- AI Agents and MCP on every plan. Including free, which lets assistants query analytics directly.
- Session replay included from free. 10,000 monthly replays at no cost is unusual.
- Credible at scale. Atlassian, Square, Zoom, and Qualtrics are reference customers for a reason.
Limitations
- Event-based pricing is hard to forecast. Volume tracks features shipped rather than users acquired, and reviewers report costs arriving sooner than expected.
- Growth and Enterprise are unpriced. No published figures, so evaluation requires a sales conversation.
- Expensive at scale. Reported at two to five times Mixpanel for equivalent usage, and cited as the top complaint across review sites.
- A steep learning curve. Two to four weeks for teams to become productive, and longer for non-technical users.
- Needs an owner. Meaningful dashboards require deliberate configuration, which is difficult without a dedicated analyst.
- A modest review base. 67 Capterra reviews is thin, though the enterprise customer list carries its own weight.
Amplitude Alternatives and How It Compares
- Mixpanel is the direct competitor and is consistently reported as considerably cheaper at equivalent volume, with somewhat less analytical depth.
- PostHog is the open-source option, self-hostable, with a generous free tier and a broader product suite.
- Google Analytics is free and answers traffic questions rather than behavioural ones. Most teams need both rather than one.
- Semrush and other SEO platforms cover acquisition rather than in-product behaviour, and complement rather than compete.
- Heap competes on automatic event capture, which removes some instrumentation work at the cost of data hygiene.
For a broader view, browse our product analytics directory.
The Verdict
Amplitude is the strongest behavioural analytics platform available to most teams, and its free tier is unusually good: 2 million events a month forever, with session replay and AI agents included, is a real product rather than a demo. For an early-stage company, particularly one that qualifies for the startup scholarship and its free year of Growth, the economics are close to unbeatable.
Understand the meter before you commit, though. Amplitude charges by events, and events grow with what your product does rather than with how many customers you have. Teams repeatedly report the same experience: a feature launch increases instrumentation, event volume climbs faster than user count, and a procurement conversation arrives months before anyone had budgeted for it. Use the bill estimator with a realistic forecast of your instrumentation, not your traffic.
Two further cautions. Growth and Enterprise carry no published pricing at all, so comparison requires a sales process, and reviewers report Amplitude running two to five times Mixpanel’s cost at equivalent usage. And budget two to four weeks of ramp: this is a tool that rewards a dedicated owner and frustrates teams hoping for insight without configuration. If you have that person, it is excellent. If you do not, you will pay for capability you never reach.
FAQ
How does Amplitude count events?
An event is any tracked user action: a button click, a page view, a signup, a purchase. One user in one session can generate many events, and a single monthly tracked user can generate dozens across a month. Crucially, event volume grows as you instrument more of your product, so shipping features increases your bill even if your user count is flat.
Is Amplitude’s free plan actually free?
Yes, and generously so. The Free plan includes 2 million events per month forever with no credit card required, plus 10,000 monthly session replays, basic product analytics, AI Agents with MCP, and 500 active AI Visibility prompts. It is a working tier rather than a trial. Note that the Plus plan, which “starts at $0”, is different: it gives the first 2M events free but requires a card and charges by usage beyond that.
How much does Amplitude cost at scale?
Amplitude does not publish pricing for its Growth and Enterprise tiers, both of which are event-based and quoted through sales. Reviewers across multiple platforms report Amplitude costing roughly two to five times Mixpanel for equivalent usage, and expensive pricing at scale is the most commonly cited complaint.
Does Amplitude offer anything for startups?
Yes, and it is not widely publicized. Companies with under $10 million in funding and fewer than 20 employees can receive one free year of the Growth plan through Amplitude’s startup scholarship. For a qualifying early-stage team that is a substantial saving and well worth applying for before paying for anything.
Is Amplitude hard to learn?
Reasonably, yes. Reviewers consistently describe a two-to-four-week ramp before teams feel productive, with non-technical users at the longer end, and note that meaningful dashboards require deliberate configuration. It rewards teams with a dedicated analytics owner and disappoints those expecting insight without setup work.

Compare Amplitude Analytics with other popular tools in the same category.
The endless options available to view data. i.e. chart types The features that allow you to easily organize the data. i.e. custom events, cohorts and event properties Templates are very usefull for bigenners
The pricing The dashboard UX should be a lot better, more features and better UI design
A. Transperancy and monitoring - Provieds full and accurate view of whats going on B. Desicion making - Allows me to avoide making desicion based on a feeling
the range of thing and reports you can you
that you can not connect it with a sheet and take some time to be really usefull
give me insights of what platforms are doing well
Oh, I really like how Amplitude Analytics provides in-depth insights into user behavior and helps me understand how people interact with my website or app. The real-time analytics and user-friendly interface make it easy for me to track key metrics and make data-driven decisions. Plus, the platform's flexibility allows me to create custom reports and analyze specific events, giving me a comprehensive view of user engagement. Overall, it's a powerful tool that greatly enhances my ability to optimize and improve the user experience.
Well, one thing that can be a bit challenging with Amplitude Analytics is the learning curve. It took me some time to fully grasp all the features and functionalities the platform offers. The abundance of options and settings can be overwhelming for beginners, and I wish there were more comprehensive tutorials or guides to make the onboarding process smoother. Additionally, while the basic features are user-friendly, some advanced functionalities may require a deeper understanding of analytics concepts. Sometimes, I find myself spending extra time figuring out how to set up more complex analyses or interpret certain data points. Lastly, the cost can be a consideration for smaller businesses or startups. The pricing structure may be a bit steep for those on a tight budget, especially as the scale of data and usage increases. It would be great to see more affordable plans or flexible options tailored to the needs of smaller businesses.
Amplitude Analytics is instrumental in solving several crucial problems related to understanding user behavior and improving the overall performance of my website or app. Here are a few key benefits: Insights into User Behavior: Amplitude helps me gain deep insights into how users interact with my platform. By tracking user journeys, identifying popular features, and analyzing drop-off points, I can make informed decisions to enhance the overall user experience. Data-Driven Decision-Making: With Amplitude, I can base my decisions on real-time, accurate data rather than relying on assumptions or gut feelings. This ensures that any changes or updates I make to the platform are backed by solid analytics, increasing the likelihood of success. Optimizing User Engagement: Understanding user engagement patterns allows me to optimize the content, features, and overall design of my website or app. This helps in retaining users, increasing session durations, and ultimately driving business goals. Personalization and Targeting: Amplitude enables me to create targeted marketing campaigns and personalized experiences. By analyzing user segments and behavior, I can tailor messages and promotions to specific audiences, improving the effectiveness of my marketing efforts. Identifying and Fixing Issues: The platform's ability to track events and user interactions helps me quickly identify any technical issues or bottlenecks within the application. This proactive approach allows for prompt issue resolution, ensuring a smooth user experience. In summary, Amplitude Analytics is a valuable tool for me as it provides the insights needed to refine and optimize my digital presence, ultimately leading to better user satisfaction and business success.
The ease of use once you understand the basics
As a new user is difficult to understand but once you get used to it its fine, maybe a better onboarding where its almost like "Amplitude university"
Lack of data and attribution
The best thing about amplitude is to create a number of different types of charts as per your need which actually helps us to track customer experience and improve our product and it is effortless to implement the charts.
There is no such downside but yeah chart types can be improved further.
By using amplitude, we are able to track our customer experience and journey on our product, and with those data we are improving our product to meet customer needs.
The analytics are comprehensive, but it's the rest of the package I have found distinctly beneficial. First, the Support documentation is well-organized and complete. 9 times out of 10 I can pretty easily find what I am looking for when I hit a wall. I self-taught Amplitude from just thier UI and some reliance on Support, starting from kind of zero user behavior analysis skills. Articles and blogs are especially helpful in giving me the context for my data quieries. They help me describe what I am doing and why to others. Last, I really need ot point out the in-app prompts that make it all work. Hover tooltips are extremely well done to keep me oriented, not going down a blind path. They really nail to in-app instrucive nature. (I oversee in-app instruction in my own software so I know what I am talking about with this).
There are several ways to get an analysis done, or best approaches. I miss having a CS person or ready-available guideperson who can get me over a hump to put me on the right path. I know what I want to know, but not always sure how to get it done. It's usually specific and I would benefit from a human being (NOT an AI) who can understand what I am trying to do and suggest a more streamlined course. Sometimes it is hard to know if I can really trust my results.
I can can data-driven statements to help influence our design and development work.
Great UI, great visuals, lots of charts for all kind of needs, reliable experimentation platform (this one I'm going to miss actually!), as a data-driven PM I can't be happier honestly.
Quotas don't really make sense for in-house analytic, leading to cases when PMs are forced to decide what events they absolutely need to track and when is nice-to-have but probably won't feed into current quota limits so out of question. And it might get very expensive very fast, justifying a move to another alternative solution, which there are plenty on the market.
For us it's solving all business needs, apart from actually storing event (we ue clickhouse for that). Experimentation, data analysis, trends, dashboards for each domain/surface/feature. Basically whole analytics is done in amplitude and it's a go-to place for insights into each step of user journeys.

Amplitude Analytics impresses with its user-friendly interface and powerful data analysis. It's a valuable tool for understanding user behavior and making data-driven decisions. Highly recommended!
While Amplitude is highly customizable, there are times when we wished for even more flexibility in creating custom events or tracking specific user actions. Also, We need more customizable Table visualisation.
In the banking sphere, optimizing conversion is crucial for web and mobile apps. With Amplitude we analyze user behaviour and metrics, which directly impacts revenue and business growth.
Prior to Amplitude, we were using 3 pieces of software for analytics, experimentation, and personalization. Amplitude rolls all three of these into one product, at a price that was noticeably cheaper. Amplitude also easily connects to our dataset and salesforce, which gives us much deeper analytics than front-end interactions (although it does that well) Amplitude integrations were easy to set up, we connected to Segment without issue. The charts are easy to create and I really like the anomaly and forecast charts. The emails I get that allow for root-cause analysis has been super useful. I check Amplitude daily. I've found generally speaking the responsiveness of support to be decent and the self-serve portal is very easy to navigate. Away from that, there's loads of official and unofficial YouTube videos that are easy to discover
One of the things I'd like to be able to see, which exists in Salesforce, is whether we're on track/on-target. Amplitude won't let you set KPIs and then report based on them. Being able to add them to a dashboard would be so useful to those who regularly check the software.
We use Amplitude to understand how prospects and customers navigate from PoC to success. We use this to create look-alike campaigns to drive better conversion. As Amplitude to connected to our SaaS, we are able to make better product decisions. We frequently make top-of-funnel decisions based off of website data and experiments powered by amplitude
-> Analytics: You can learn too much about your digital product with conversion drivers, user journey, or even a funnel chart. With a powerful data governance process providing a scalable Taxonomy for self-service usability inside the platform. With an important point: Export public links of our notebooks analyses. -> Implementation: Completely ease to use Ampli CLI -> Integrations: Insane PLUG AND PLAY Integrations. -> Frequency: Every single day. -> Amazing Support by Product Minds and Amplitude Team
It's really difficult to find something that I don't like inside Analytics, but nowadays the complexity of deep analyses like Personas. It is really difficult to expand for all teams.
-> Understanding why the users are dropping off the funnel. -> Understanding conversion drivers -> Propagating self-service insights, analyses and data for all my coleagues.