

Unclaimed: Are you working at Baremetrics?
Baremetrics Reviews: 4.6/5 — Highly Rated
Baremetrics is an analytics solution used by SaaS companies that use Stripe to manage their recurring billing transactions with customers. Baremetrics lets users enjoy single-click functionality that gives you access to dashboards from a list of metrics including analysis of fees, revenue, upgrades, downgrades, and churn. The platform also allows users to generate forecasts and see all planned activity such as MRR and LTV.

| Capabilities |
API
|
|---|---|
| Segment |
Small Business
Mid Market
Enterprise
|
| Deployment | Cloud / SaaS / Web-Based |
| Support | 24/7 (Live rep), Chat, Email/Help Desk, FAQs/Forum, Knowledge Base, Phone Support |
| Training | Documentation |
| Languages | English |

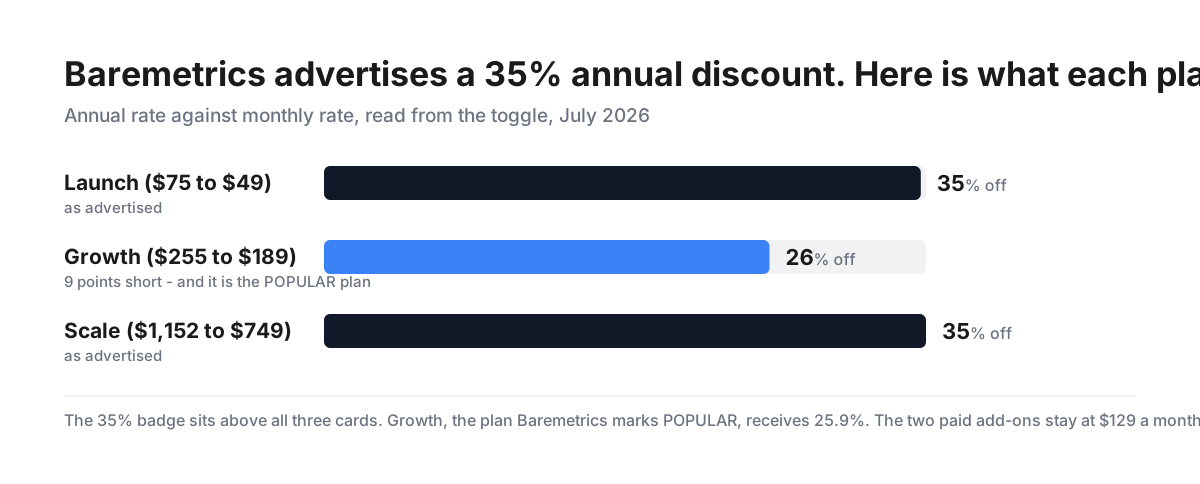
Baremetrics puts a “35% Annual Discount” badge above all three plans. Switch the toggle and Launch gets 34.7%, Scale gets 35.0% — and Growth, the plan labelled POPULAR, gets 25.9%. That is nine percentage points short of the headline on the tier most buyers will pick. We verified it in both billing states, visually and arithmetically: $255 to $189 is not 35%.
- What it is: Subscription analytics for SaaS — MRR, churn, forecasting and dunning.
- Best for: Stripe-based SaaS businesses that want metrics without building them.
- Pricing: From $49, $189 or $749 a month, banded by your ARR. Verified July 2026.
- The honest catch: Every price says “STARTS AT” and the scaling is unpublished.
What Is Baremetrics?
Baremetrics turns subscription billing data into business metrics — MRR, churn, LTV, trial conversion and cohort analysis — without you building a reporting pipeline. It plugs into Stripe and other billing systems and layers on segmentation, custom dashboards, goal tracking, benchmarks and forecasting. Two paid add-ons handle revenue operations: Payment Recovery for failed-card dunning and Cancellation Insights for churn feedback.
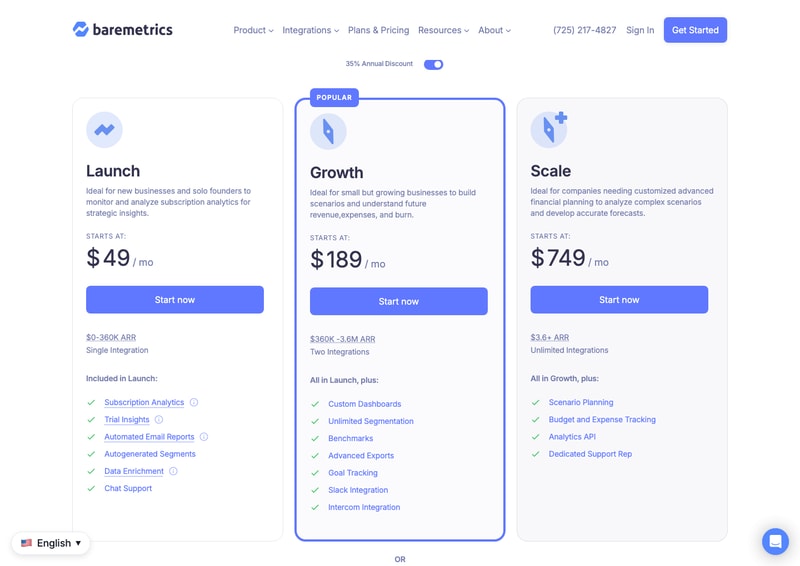
Note the “35% Annual Discount” toggle above the cards.
How Baremetrics Works
- Three plans, banded by your ARR.
- Prices “START AT” — they scale within each band.
- Annual toggle on by default.
- Integrations limited by tier: 1, 2, unlimited.
- Two add-ons at $129 a month each.
- Custom plans by sales call.
Baremetrics Pricing
Captured from Baremetrics’ pricing page in July 2026 in US dollars, reading both states of the billing toggle and confirming each visually.
| Plan | Annual (per month) | Monthly | Actual discount | ARR band | Integrations |
|---|---|---|---|---|---|
| Launch | $49 | $75 | 34.7% | $0–360K | 1 |
| Growth (POPULAR) | $189 | $255 | 25.9% | $360K–3.6M | 2 |
| Scale | $749 | $1,152 | 35.0% | $3.6M+ | Unlimited |
| Annualised | Launch | Growth | Scale |
|---|---|---|---|
| Per year at the annual rate | $588 | $2,268 | $8,988 |
| Per year at the monthly rate | $900 | $3,060 | $13,824 |
| Add-ons (either billing state) | Price | Versus Launch |
|---|---|---|
| Payment Recovery | +$129/mo | 2.6× the entry plan |
| Cancellation Insights | +$129/mo | 2.6× the entry plan |
| Financial Planning Services | Contact sales | — |
What actually decides your cost:
- The 35% discount claim does not hold on the middle plan. With the toggle on, prices read $49, $189 and $749; with it off, $75, $255 and $1,152. Work each one out: Launch saves 34.7%, Scale saves 35.0%, and Growth saves 25.9%. The badge sits above all three cards without qualification, and the shortfall lands on the tier Baremetrics itself marks POPULAR — the one most buyers will choose. In cash terms Growth saves $66 a month where 35% would have been $89, a difference of $276 a year.
- Every price is a floor, not a price. All three cards say “STARTS AT”, and each is tied to an ARR band — $0–360K, $360K–3.6M, $3.6M+. So what you actually pay depends on your revenue within the band, and Baremetrics publishes no scaling formula. A business at $50K ARR and one at $350K are both on Launch and both told “starts at $49”. Treat the published figures as entry points and get a quote for your actual revenue.
- The add-ons cost more than the entry plan, and get no annual discount. Payment Recovery and Cancellation Insights are $129 a month each — 2.6 times the $49 Launch price. Take both and your bill is $307 a month, of which the add-ons are 84%. Critically, the $129 figures are identical in both billing states: the annual toggle moves the plan prices and leaves the add-ons untouched, so the “35% Annual Discount” does not apply to them at all.
- Payment Recovery comes with an unusual guarantee. Baremetrics states: “Guaranteed ROI — Recover more than your Baremetrics cost or your next month is free.” That is a real commitment rather than marketing hedging, and it reframes the $129: if the dunning tools do not recover more than you spend, you are not out of pocket for the following month. The terms of how “cost” is measured are not spelled out on the pricing page, so confirm the mechanics before relying on it.
- Integration count is a hard limit that scales oddly. Launch allows a single integration, Growth two, Scale unlimited. For a business running Stripe alone that is irrelevant; for one running Stripe plus Apple App Store, or Stripe plus Recurly, the jump from one to two integrations means moving from $49 to $189 — a 286% increase — regardless of your ARR. If you have two billing sources, that is your real price floor.
- The annual toggle is on by default, so the first number you see is the discounted one. The page loads with the discount applied. There is nothing dishonest about that — the toggle is clearly labelled and visible — but it means the monthly figures of $75, $255 and $1,152 are the ones a buyer has to go looking for, and those are what you pay without a year’s commitment.
- The gap between tiers is very large in absolute terms. $49 to $189 to $749 a month — annualised, $588, $2,268 and $8,988. Growth costs 3.9× Launch and Scale costs 4.0× Growth. Since the tiers are gated by ARR bands rather than chosen freely, crossing $360K ARR or $3.6M ARR is a step change in your tooling cost, not a gradual one. Worth modelling before you cross either line.
- What each tier adds is coherent, at least. Launch covers subscription analytics, trial insights, automated email reports, autogenerated segments, data enrichment and chat support. Growth adds custom dashboards, unlimited segmentation, benchmarks, advanced exports, goal tracking and Slack and Intercom integrations. Scale adds scenario planning, budget and expense tracking, the analytics API and a dedicated support rep. The features track the ARR bands sensibly; it is the price steps that are steep.
- A build-your-own option exists and is quote-only. Baremetrics offers “Mix and match the features you need” via a custom pricing booking link, plus separate Financial Planning Services on a contact-sales basis. Neither has published pricing, so if the banded plans do not fit, the only route is a call.
Who Should Use Baremetrics
- Stripe-based SaaS under $360K ARR. The clearest case — $49 a month for a full metrics suite.
- Businesses fighting involuntary churn. Payment Recovery with a stated ROI guarantee.
- Teams that want forecasting. Scenario planning and budget tracking on Scale.
- Founders who would otherwise build it. Cohorts, LTV and MRR without a data pipeline.
It fits poorly for companies with two billing sources on a budget, since that alone forces the $189 tier; for buyers who need a firm price before talking to sales, given every figure “starts at”; and for anyone attracted specifically by the 35% annual claim on the Growth plan.
Honest Pros and Cons
Strengths
- $49 a month is reasonable for a complete metrics suite.
- Payment Recovery carries a stated ROI guarantee.
- Feature tiers track the ARR bands sensibly.
- Annual discount is real on Launch and Scale.
- Custom plans available for unusual requirements.
- Scenario planning and analytics API at the top tier.
Limitations
- The 35% claim is 25.9% on the POPULAR plan.
- Add-ons get no annual discount at all.
- Each add-on costs 2.6× the entry plan.
- Every price “starts at” with no published scaling.
- Two integrations require the $189 tier.
- Tier steps are ~4× each.
Baremetrics Alternatives and How It Compares
- ChartMogul is the closest direct competitor on subscription analytics.
- ProfitWell Metrics offers core SaaS metrics free, monetising retention products.
- Stripe Sigma and Stripe’s own dashboards cover basics without a third party.
- Churnkey specialises in cancellation flows and involuntary churn recovery.
- Maxio targets larger businesses needing billing plus revenue recognition.
The Verdict
Baremetrics does a genuinely useful job — MRR, churn, LTV, cohorts and trial conversion out of your billing data without building a pipeline — and at $49 a month the entry tier is fairly priced for a business under $360K ARR. The feature ladder is coherent too: Growth adds dashboards, segmentation, benchmarks and goal tracking; Scale adds scenario planning, budget tracking and an analytics API. If you are a Stripe-based SaaS and metrics are currently a spreadsheet, this is a reasonable purchase.
What the pricing page does not survive is arithmetic. A “35% Annual Discount” badge sits above all three cards. Toggle it and the real figures are 34.7% on Launch, 35.0% on Scale — and 25.9% on Growth, the plan Baremetrics marks POPULAR. We confirmed this in both states, visually and by calculation: $255 to $189 saves $66 a month where 35% would save $89, a shortfall of $276 a year for the tier most buyers will land on. The claim holds on two plans out of three, and fails on the one it matters most for.
The add-ons are the other thing to price carefully. Payment Recovery and Cancellation Insights are $129 a month each — 2.6 times the entry plan — and their prices are identical in both billing states, so the annual discount does not touch them. A Launch customer taking both pays $307 a month, of which 84% is add-ons. In fairness, Payment Recovery carries a stated “Guaranteed ROI — Recover more than your Baremetrics cost or your next month is free”, which is a firmer commitment than most vendors offer; just confirm how “cost” is measured before you count on it.
Two structural points before you commit. Every headline says “STARTS AT” and each plan is tied to an ARR band, with no published scaling inside those bands — so a business at $350K ARR has no way to know what it will pay on a plan advertised at $49. And integration count is a hard gate: one on Launch, two on Growth. If you bill through Stripe and the App Store, your floor is $189, not $49, whatever your revenue. Model both before you take the published price at face value.
FAQ
How much does Baremetrics cost?
Three ARR-banded plans, in US dollars as captured July 2026. With annual billing: Launch $49 a month ($0–360K ARR), Growth $189 ($360K–3.6M), Scale $749 ($3.6M+) — about $588, $2,268 and $8,988 a year. Billed monthly they are $75, $255 and $1,152. All three are marked “STARTS AT”, so prices rise within each band by an unpublished formula.
Is Baremetrics’ 35% annual discount accurate?
On two plans out of three. Comparing both toggle states, Launch saves 34.7% ($75 to $49) and Scale saves 35.0% ($1,152 to $749), but Growth saves only 25.9% ($255 to $189) — nine percentage points below the advertised figure, on the plan marked POPULAR. The two paid add-ons receive no annual discount at all; they stay at $129 a month in both states.
How much do Baremetrics’ add-ons cost?
$129 a month each for Payment Recovery and Cancellation Insights — 2.6 times the $49 Launch plan. Taking both alongside Launch brings the bill to $307 a month, with the add-ons making up 84% of it. Payment Recovery does carry a stated guarantee: recover more than your Baremetrics cost or your next month is free.
Why does Baremetrics say “starts at”?
Because pricing scales with your revenue inside each ARR band — $0–360K on Launch, $360K–3.6M on Growth, $3.6M+ on Scale. Baremetrics does not publish how the price rises within a band, so the advertised figures are entry points rather than quotes. A business near the top of a band should expect to pay more than the headline and should ask for its actual number.
How many integrations does Baremetrics allow?
One on Launch, two on Growth, unlimited on Scale. This is a hard limit independent of revenue, so a business billing through two systems — Stripe plus the App Store, for instance — needs Growth at $189 a month even if its ARR would place it on Launch. That is a 286% increase driven purely by integration count.

- I get a full breakdown of the MRR with all the SaaS metrics I need on the financial side. - The Baremetrics dashboard is part of my daily routine to understand the business better. - Plug and play, easy to integrate and use. - Great support.
I could use an even deeper revenue breakdown: - Retention by locale. - Better understanding of teams. - Mixing in usage data could be a value multiplier.
Understanding saas metrics; mrr, retention/churn, expansion, new users, etc.
We've been using Baremetrics at Momentum Dashboard, and it has truly been a game-changer for us! One standout feature for us has been the churn analysis. Identifying patterns and understanding why customers are canceling their Momentum Plus subscription has helped us to make strategic adjustments and enhance our customer retention efforts. The insights we're getting from Baremetrics have contributed to a more proactive and effective approach to customer retention.
While it has proven to be a great tool for our business, one area where there could be improvement is in the level of customization for certain reports. While the existing reports are comprehensive, having even more flexibility to tailor reports would be beneficial.
With Baremetrics, we have a centralized platform that provides real-time insights into critical metrics, such as Monthly Recurring Revenue (MRR) and cancellation rates. This not only saves us time but also empowers us to make data-driven decisions. The cancellation analysis feature has been particularly beneficial in identifying patterns and reasons behind customer cancellations, allowing us to implement proactive measures to enhance customer retention.
Great app, shows us tons of different metrics. We rely on this platform for all of our salesforce reporting. Customer support is fantastic, our AM is always available to jump on calls and answer questions.
Not being able to filter by day makes it a bit difficult to use.
Keeping track of all of our customer movements. We would be lost without this tool to track everything for us.
Easy to setup and all important metrics at a glance.
Custom usage charges not ideally implemented just yet.
Helps to get rid of a lot of Excel magic, streamlines the analytics processes
- UX is great - Link to Stripe from BM - Slicing data with filters - Slack integration - Customer Support is excellent - Helpful documentation
- Lack of invoice details attached to payments
Tracking subscription statuses, identifying at risk subscription, and managing churn

Baremetrics is a one-stop shop for the majority of data that I use in reports and for planning purposes. I check it daily (at least). I can easily toggle between MRR data, customer info, and forecasts of my company's financial health using variables I get to set. Baremetrics also has outstanding customer support. The few times we've had issues or questions, they responded quickly and were friendly. I/we truly felt like they cared.
The Forecast tool takes some time to get set up, but once it knows what data to include and where to pull it from, it's well worth the effort.
Baremetrics helps me keep track of the real and relative health of our company. The data it collects and the charts it creates make it easy to see how we're doing and what our future holds.

Baremetrics help me gain a full understanding of my business growth, as well as where I can improve (ie churn, retention)
Sometimes the data between stripe and baremetrics can be a little off. I believe this is more to do with some of the stripe settings.
Baremetrics helps me understand my key metrics such as; MRR, NRR, Expansion and Churn. It also aids in understanding my LTV so i can adequately allocate funds for ads and marketing efforts.
Baremetrics is easy to use and gives you detailed insights for keeping a close eye on your revenue. Their support team is great – they're quick to respond and always provide helpful and clear guidance.
Would like additional options and filters with segmentation. Would love to have drop downs for filtering different segmentents.
I'm able to consolidate all my numbers in one place: Stripe, Google, Apple and we pull in PayPal through the API. Also, they have the best accuracy. I've tried Chartmogul and Baremetrics is far more accurate.
Baremetrics is straight forward to use, and provides very detailed insights that can be used for revenue monitoring. The support team is amazing-very responsive and always provides thorough and accurate guidance.
It can be difficult to update an account that was not initially setup for auto-renewal.
Collecting ACH payments is streamlined with Baremetrics. The Stripe integartion makes the platform seamless.
The ease of use and analytics at a glance where we connected Apple, Google and Stripe. Great onboarding and customer support!
I think the one thing initially was the wait-time to get things synced up took about 16 hours in total to wait for all platforms to sync. Other than that nothing else.
Consolidation of all platforms into one.
The plateforme is perfectly organised. As a saas founder, i really care about simplicity on the product. You guys are doing great. I can easely check my metrics now.
Maybe they are too many options that I still need to discover on the product.
Calculating my churn.
With Baremetrics, we're able to parse our App Store subscription data easily and get a clear view on the health of your SaaS product. The customer support has also been very helpful.
I can't think of anything that I dislike
Our product has an Apple subscription, which means we have to rely on App Store Connect to look at our subscription analytics. However, Apple's trends section is limited and doesn't give us the flexibility to view metrics in a way that is easy to analyze by cohorts. Baremetrics helps us view our metrics in an easy and understandable way.
What I love about Baremetrics is the fact that literally anyone can use it and figure it out quick. I tested it with my team and everyone was able to see, learn, and breakdown all of our metrics. Not only is it easy to use, but it really does provide great data and insights that you may have missed before on Stripe. Last but not least, the UI is awesome! Customer support for us is another plus and they really kill it
To be completely honest, have not found much to dislike.
We have not had a clear cut way to view our subscriber information, and as a team of young founders, it really helps us understand what is important to see & know.
Their customizable metrics dashboard makes it so easy to focus on the specific metrics I want. The ability to annotate the charts and really breakdown our data into smaller segments is very helpful and easy to use.
Very saas focused. I'd love to see additional metrics that include one time purchases and other non-recurring revenue.
Baremetrics allows me to easily understand which plans are most valuable to my company. Looking at metrics by plan type provides a lot of insight that is difficult to report on otherwise.

It's very easy to use and implement - all i need to do is connect my Stripe and i will have everything up on my dashboard. I also love that it's automated, and all the information is on a consolidated dashboard.
I think it's a great tool so far, but will be great if we can have insights on our business, metrics to compare against etc. I know they have a few right now on the dashboard, and i look forward to more features.
Having a consolidated overview on all our financial metrics + easy for me to do reporting e.g. investor updates.
I love getting a quick snapshot of all my key SaaS metrics. It helps me avoid having to put too much weight on a CFO or finance team and instead be self reliant and analyze our revenue and churn data myself. I love the fact that it's all plugged into Shopify + Stripe so it's always up to date with our billing and I love all the helpful tips on how metrics are calculated and how we rank compared to other companies. I've been using this platform for over a year and can't imagine my life without it.
I would love to see NDR calculated in the dashboard. I don't love that our free plan is considered a "trial" in Baremetrics and not sure how to fix that. I would love a way to more easily see total $ churn in certain date ranges. I always have to manually add up the full list of customer churn manually.
Quick view into key SaaS metrics like revenue, churn, growth, etc. It helps me prevent getting a CFO involved nearly as much as I would have to without them.
Love the ability to track all the metrics that are meaingful to running a high performance SaaS company.
None so far, very happy with all the features and support.
Makes it easy to track all performance indicators necessary for SaaS.
The tool is insanely fast. The customer service and customer obsession is insane. 10/10 would recommend.
Nothing as of now. Full disclosure: Am yet to fully explore the tool to understand the nuances.
1. Subscription analytics

I like the user interface and the fact that many of the key metrics are accessible so quickly in the product with minimal setup. It is really honed in on the financial health of our SaaS product and integrates well with the accounting software we use, xero.com (it works with QB as well). It's a great product to make sense of revenue, profit, churn and more (ARR, MRR, MRR Growth, ARPU, LTV, much much more) at a glance. We like it and our investors like how meaningful data is clearly presented. Support is great. Andrew, our salesperson was great.
Can't say that I've run into anything I dislike so far.
Being able to see the heartbeat of our business, at least related to cash in and cash out and, revenue, margin, churn, growth and more.
I've used Baremetrcs twice now, at my last startup and this new one. It's my go to daily dashboard to quickly see how the business is performing. I like the breakdown of stats by plan especially and the daily notifications.
It's not the cheapest but will save you time in calculating all of the stast yourself.
Dashboard for KPIS, notifications, breakdown of plans by churn / MRR etc
- Consolidated metrics across payment providers
- Integrating into cross-platform workflows is a big job
Subscription analytics
The support is agile and very good. The metric works very well with stripe.
Its a little hard to understand some features.
Baremetrics help us solve the problem of gathering subscriptions information in one place
Within an hour, we were able to see detailed metrics about our subscription product including LTV, churn, quick ratio, growth and more. The data was far more detailed than what we got out of Stripe out of the box while being easy to use. Regular notifications are also very helpful to monitor failed transaction rates.
Overall a great product. I would like an easier way to configure a custom domain for Baremetrics Recover since the current URL leads to a Baremetrics domain. This reduced the effectiveness of dunning.
Baremetrics helps to analyze subscription metrics while staying in sync with our payment processor. It also provides dunning services with one click for payments recovery.
We have loved using Baremetrics as a tool to keep our growing business on track! Their tools help us with our forecasting and give us a better understanding of our customer's behaviour.
It is extremely expensive. Even with a 25% discount it is nearly out of our price range
understanding why our customers are cancelling. Forecasting correctly. Keeping a close eye on our churn.
It has just about every graph, chart, or metric that a SaaS business could ever want. It's extremely helpful to instantly know things like LTV across different customer segments and plans, see how churn has changed over time, and overall it provides a lot of insight that just doesn't exist directly in most billing platforms.
The only downside is that I tried to export a CSV file of a specific metric, which was "Churned Users", but the CSV was only able to be exported with aggregate numbers instead of exporting with different columns for different plans or segments you're comparing in the graph mode. If anyone from Baremetrics reads this, it would be a really useful feature!
Knowing key business metrics can be difficult if you're trying to scrape together the data and analytics on your own. Being able to see these at a glance at any time has proven to be really beneficial strategic knowledge.
I love how the dashboard gives me a great overview of my business health in one convenient place.
Can't think of any downsides currently...
Keeping track of key metrics
Our company has been using Baremetrics for a couple of years now to automate the recovery of subscription payments that fail. We give the system 7 days to recover before stepping in with a personal touch. Some of my favorite features are the monthly failed rate and % recovered, as well as being able to see a complete overview of all recovery campaigns and their status. Anytime I've needed to reach out to support, it was always a quick and easy process and their support is very helpful!
No complaints. I would like some clarity on the factors the system uses to consider an account recovered since our business has different subscription levels, sometimes after a payment has failed, our staff reach out to the member, and they lower their sub rate, which should be a "recovery" but appears it isn't one on Baremetrics.
automatically reaching out to a customer when a subscription payment fails to recover payment.
Baremetrics is super easy to use, very intuitive. One of my primary uses for Baremetrics for the role in our company is keeping notes on our customers regarding customer service in Baremetrics Customer section. It's super convenient to have everything in one place. I also have always received responsive, respectful and kind customer service.
The notes section for customers is a little difficult to read if keeping a good amount of notes on each one. Once saved it all runs together rather than retaining the returns between each encounter/day. And this isn't a big issue, just a UX improvement. Also, I reported an issue that occurs in the customer section arriving on a customer page, the info on the left maintains the previous customer information. The customer service rep let me know a way to correct it is to refresh the page after arriving there, which does work and, again, isn't a big issue - just UX. Otherwise, it's great!
Communication between our business associates and myself regarding customer interaction is a big problem that is solved using Baremetrics. I really appreciate the notes section. This is also a big benefit for me.
Baremetrics is a fantastic product that pulls all your revenue data into one easy to view dashboard. Its retention tables and recover tools are particularly cool and its customer service is second to none.
There's nothing I dislike about Baremetrics. It's easy to set up, easy for teams to understand data and easy to act upon it. I really love the annotation tool too.
It's stopping us from calculating things like ARR in spreadsheets and it's providing a single view on things like retention tables. We've only just started using it though so yet to see the impact of this single view.
Baremetrics support is amazing. Their content is amazing. Their platform is amazing. Everything about the company is top-notch. Their USP is "Baremetrics is Subscription Analytics and Insights: One click and you get hundreds of valuable metrics and business insights!" And that is EXACTLY what they deliver.
Nothing. I have no feedback on what I dislike because it doesn't exist.
Baremetrics helped me get all my key metrics and KPIs into one organized place.