

Databox Reviews: 4.4/5 — Solid Choice
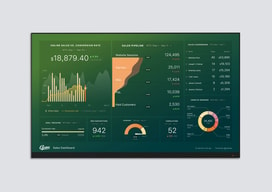
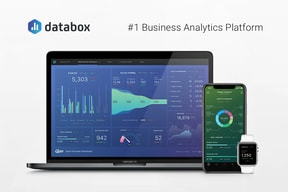
Databox is a cloud-based business analytics tool that lets users create custom analytics dashboards incorporating data from multiple sources, viewable from any device. The platform is specifically designed for high-level executives, analysts, and marketers, and makes navigation easy through single-click integrations, the advanced settings for unique metrics, and time intervals that can be modified and tailored to your needs.

| Capabilities |
API
|
|---|---|
| Segment |
Small Business
Mid Market
Enterprise
|
| Deployment | Cloud / SaaS / Web-Based, Mobile Android, Mobile iPad, Mobile iPhone |
| Support | 24/7 (Live rep), Chat, Email/Help Desk, FAQs/Forum, Knowledge Base, Phone Support |
| Training | Documentation |
| Languages | English |




Databox’s Analyst plan costs $64 a month and includes 5 data sources. Pro costs $159 and includes 3. Growth costs $399 and includes 3 — the same as the free plan. Data sources are the thing a dashboard tool connects to, and on the business tiers they do not scale with price at all. What the money buys is unlimited users and AI credits; extra sources are sold separately at $5.60 a month each — or $2.40 if you buy the identically priced agency plan instead.
- What it is: A dashboard and business analytics platform pulling metrics from many sources into one view.
- Best for: Teams needing unlimited users; agencies should use the agency tab regardless.
- Pricing: Free $0; Analyst $64, Pro $159, Growth $399 per month billed annually. Verified July 2026.
- The honest catch: Additional data sources cost 133% more on business plans than agency plans.
What Is Databox?
Databox builds custom analytics dashboards from data across many tools — marketing, sales, finance and support — viewable on any device, with AI features (Genie, an MCP server, forecasting) layered on top. It claims more than 20,000 companies and holds a 4.5-star average across 184 Findstack reviews.
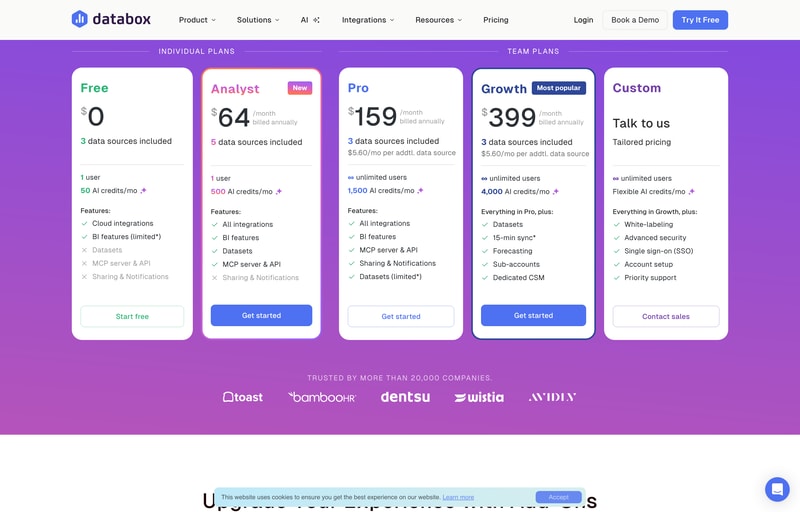
The page splits into Plans for Businesses and Plans for Agencies, with a 14-day free trial of Growth to start.
How Databox Works
- Two meters — data sources and AI credits.
- Sources do not scale with the business tiers.
- Extra sources are sold per month, at two different rates.
- Unlimited users from Pro upward.
- Annual billing saves about 20%.
- Agency plans cost the same but include more.
Databox Pricing
Captured from Databox’s pricing page in July 2026 in US dollars, reading both billing toggles and both tabs.
| Business plan | Monthly | Annual | Saving | Sources | Extra source | Users | AI credits/mo |
|---|---|---|---|---|---|---|---|
| Free | $0 | $0 | — | 3 | — | 1 | 50 |
| Analyst | $79 | $64 | 19.0% | 5 | — | 1 | 500 |
| Pro | $199 | $159 | 20.1% | 3 | $5.60/mo | Unlimited | 1,500 |
| Growth | $499 | $399 | 20.0% | 3 | $5.60/mo | Unlimited | 4,000 |
| Custom | Quoted | Quoted | — | — | — | Unlimited | Flexible |
| Agency plan | Annual | Sources | Extra source | Client accounts | AI credits/mo |
|---|---|---|---|---|---|
| Agency Starter | $79 | 3 | $2.40/mo | 5 | 500 |
| Agency Pro | $159 | 3 | $2.40/mo | Unlimited | 1,500 |
| Agency Growth | $399 | 3 | $2.40/mo | Unlimited | 4,000 |
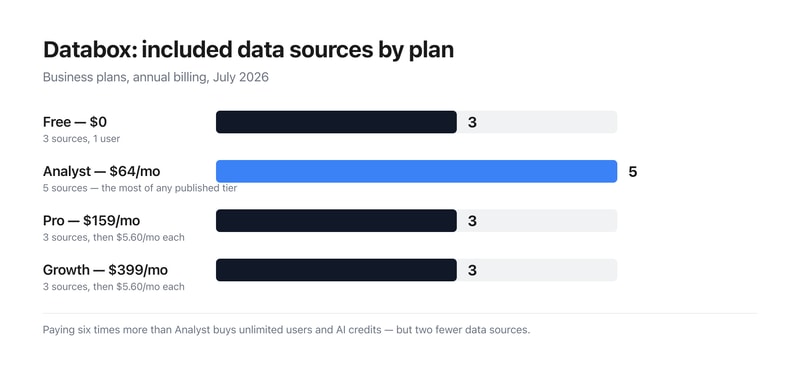
What actually decides your cost:
- Included data sources go 3, 5, 3, 3 as the price goes 0, 64, 159, 399. The cheapest paid plan includes the most sources of any published business tier, and the $399 plan includes no more than the free one. Sources are the primary thing a dashboard product connects to, so anyone scanning the cards would reasonably expect them to rise. What Pro and Growth actually buy is unlimited users and larger AI credit pools; connecting more data is a separate line item.
- The same extra source costs $5.60 on business plans and $2.40 on agency plans — 133% more. Both tabs sell identical add-on capacity at different rates. Reaching 10 sources costs $198.20 a month on Pro ($159 plus seven at $5.60) against $175.80 on Agency Pro ($159 plus seven at $2.40) — a $22.40 monthly difference on the same $159 base.
- Agency Pro and Pro cost exactly the same and Agency Pro includes more. Both are $159 a month with 1,500 AI credits, 3 sources and unlimited users. Agency Pro adds unlimited client accounts and the cheaper source rate. If your work qualifies, there is no configuration where the business tab is the better buy at that price.
- Analyst is single-user, which is the constraint that defines it. Five sources and 500 AI credits for $64 is reasonable, but one seat. The jump to unlimited users is Pro at $159 — a 148% increase — and it comes with two fewer included sources, so budget the add-ons alongside it.
- AI credits scale properly, if modestly. 50, 500, 1,500 and 4,000 a month across the tiers works out at $128 per thousand credits on Analyst, $106 on Pro and $99.75 on Growth — a real but shallow volume discount of about 22% across the range.
- The 20% annual saving is essentially accurate. Pro saves 20.1% and Growth 20.0%; Analyst comes in slightly under at 19.0% ($79 to $64). Add-ons are quoted “billed annually” separately, including branding and white-labeling, 15-minute sync, a fiscal calendar and advanced security management.
Who Should Use Databox
- Agencies. The clearest case — unlimited client accounts and half-price sources at identical headline prices.
- Teams needing unlimited seats. Pro at $159 is where user limits disappear.
- Solo analysts. Analyst at $64 has the most included sources of any paid business tier.
- Heavy AI users. Growth’s 4,000 monthly credits are the cheapest per credit.
It fits poorly for businesses connecting many sources, where the per-source charge compounds; for buyers who assume higher tiers include more data; and for single users needing more than five sources, since Analyst publishes no add-on rate.
Honest Pros and Cons
Strengths
- A permanent free plan with 3 sources and 50 AI credits.
- Unlimited users from Pro upward.
- Agency plans at identical prices with more included.
- A 14-day free trial of the Growth plan.
- An MCP server and API on every tier including Free.
- Around 20% off for annual billing.
Limitations
- Growth includes the same 3 sources as the free plan.
- Analyst has more sources than plans costing 6× as much.
- Extra sources cost 133% more on business than agency plans.
- Analyst is single-user and publishes no source add-on rate.
- Datasets are limited on Pro despite being full on Analyst.
- White-labeling, fiscal calendar and 15-min sync are paid add-ons.
Databox Alternatives and How It Compares
- Klipfolio is the closest competitor on custom dashboard building.
- Geckoboard focuses on simple, TV-friendly team dashboards.
- Looker Studio is free and strong if your data is already in Google’s ecosystem.
- Power BI and Tableau are the enterprise BI platforms, deeper and considerably more complex.
The Verdict
Databox does something genuinely useful — pulls metrics from across a business into dashboards anyone can read, with a free tier that includes the API and MCP server rather than holding them back. Unlimited users from Pro upward is the right call for a reporting tool, since the people reading dashboards usually outnumber the people building them, and per-seat pricing punishes exactly the behaviour the product wants to encourage.
The structure worth understanding before choosing is that the price ladder and the data source ladder are unrelated. Free includes 3 sources, Analyst at $64 includes 5, Pro at $159 includes 3, and Growth at $399 includes 3. The cheapest paid plan carries the most included sources of any published business tier, and the most expensive carries no more than free. That is not a mistake so much as a deliberate separation — Pro and Growth sell unlimited users and AI credits, with connections priced separately at $5.60 a month each — but it inverts the natural reading of a pricing page, and it means the sticker price is not the cost. Ten sources on Pro is $198.20 a month, not $159.
The sharper point is the difference between the two tabs. Agency Pro costs exactly the same $159 as Pro, carries the same 1,500 AI credits, the same 3 sources and the same unlimited users — and adds unlimited client accounts plus extra sources at $2.40 rather than $5.60, a 57% lower rate for identical capacity. At ten sources that is $175.80 against $198.20 for the same underlying product. Anyone whose work plausibly counts as agency work should check the agency tab before buying from the business one, because at these prices the business tab is never the better deal.
FAQ
How much does Databox cost?
In US dollars captured July 2026: Free is $0, Analyst $64 per month billed annually ($79 monthly), Pro $159 ($199) and Growth $399 ($499), with Custom quoted. Agency plans run $79, $159 and $399 annually. All plans start with a 14-day free trial of Growth.
How many data sources does Databox include?
Three on Free, five on Analyst, three on Pro and three on Growth — so included sources do not increase with price on the business tiers. Pro and Growth sell additional sources at $5.60 per month each; Analyst publishes no add-on rate. Agency plans include three sources and charge $2.40 per additional source.
Should I use Databox’s business or agency plans?
If your work qualifies as agency work, the agency tab, without question. Agency Pro and Pro both cost $159 a month with the same 1,500 AI credits, three data sources and unlimited users — but Agency Pro adds unlimited client accounts and charges $2.40 per extra data source instead of $5.60, a 57% lower rate for identical capacity.
What do Databox’s AI credits cover?
Genie and the MCP server, plus generating insights, building dashboards and asking questions about your data — all drawing from a shared monthly pool. Allowances are 50 on Free, 500 on Analyst, 1,500 on Pro and 4,000 on Growth, which works out at $128, $106 and $99.75 per thousand credits on the three paid tiers. A credit top-up add-on is listed as coming soon.
Does Databox charge per user?
Only on the entry tiers. Free and Analyst are limited to one user; Pro, Growth, Custom and all three agency plans include unlimited users. That makes Pro at $159 the point where seat limits disappear — a 148% increase over Analyst, though it includes two fewer data sources.

Compare Databox with other popular tools in the same category.
Simple, good looking and seems to be a good fit
Not enough connectrs to test the free version
communication
It was a good system and easy to use. We had it connected to many different datasources. The team had been helpful in the past.
they sent me an email as my subscription payment method was declined due to a new card. The link in the email presented me with a box to enter my credit card details which I entered the new one and entered it. Then about 5 minutes later I recived a bill for $6,900 Australian dollars for a year! I never had a yearly subscription and they changed it without my concent in a very misleading and infact fraudulent way, without showing me. I have since spent a week trying to get their billing team to reverse it but they have not and now I've spent 4 hours with my bank disputing the transaction. They obviously thought that getting the year in advance was worth me writing this review. They have now lost a customer who would have spent that over the next year anyway and beyond. Absolutly unscrupulous and dishonest.
Analytics from different data sources
The training videos were a good idea but poorly done, meaning the trainers were wooden and not engaging.
Every time I went to the dashboard, the link to my LinkedIn, Facebook, and other accounts were broken. Every time! Then, when I tried to cancel, the bait and switch. I am paying for another full year of crappy service. Here is the quote: "We can help you and your Team use Databox for the remaining time however, we can't offer refunds." Great customer service.
No one could really help with the disconnecting so it was just part of the routine of how I used the service.
Everything I saw before starting to use it. The potential for a service like this is very appealing. The reality, however, is something else.
The service purports itself to be an easy solution for reporting and data analysis. The truth is that the setup and management or unstable, and difficult to set up. Many of the data sources are not set up for the data history that it carefully states as "up to" which means that you're sometimes getting weeks of data, which is technically "up to 11 months," but not practically usable. Timely customer/tech support is non-existent. I've rarely gotten same-DAY service let alone live support. When you are able to connect with a service person, I have found some to be evasive at best, defensive and argumentative at worst (due to then trying to support a service that doesn't offer much of the benefit they promote and the bait and switch service levels). The bulk of features are in the top service tiers and the lower tiers are there to serve as bait for the bait and switch tactics (see note above about data sources). The pricing menu is missing key restrictions such as custom date ranges. If you want to find any true value from this service expect to pay for the business tier ($248/mo). Even then, the data sources are not complete. There are missing data points and the data history is inconsistent from source to source. My trial was frustrating but I thought I had it set up at a place where it would be usable for monthly reporting. I subscribed to the basic service and discovered the hidden restrictions and the lack of timely support caused me to present incomplete and inaccurate data at a month-end review.
A quick way to collect and consistently visualize all of my different marketing data, and present it in an easy to understand way. It's easy to share and present the data, but getting there is not easy if you can get there at all.