

Unclaimed: Are you working at Amplitude Analytics?
Amplitude Analytics Reviews: 4.5/5 — Highly Rated
Amplitude is an analytics tool designed to support businesses by helping them understand user behavior and giving them key insights that can help them improve their products. It offers tools such as behavior tracking, funnel analysis, as well as A/B testing that combines to help companies make data-driven decisions that optimize products and drive business growth.

| Capabilities |
AI
API
|
|---|---|
| Segment |
Small Business
Mid Market
Enterprise
|
| Deployment | Cloud / SaaS / Web-Based, Mobile Android, Mobile iPad, Mobile iPhone |
| Training | Documentation |
| Languages | English |



Amplitude gives you 2 million events a month free forever, and then prices on events rather than users, which is the detail that catches people out. Event volume grows with the number of things your product does, not with how many customers you have. Teams routinely discover that shipping features, not acquiring users, is what moves them into a procurement conversation.
- What it is: A product analytics platform for understanding user behaviour, with cohorts, funnels, session replay, and experimentation.
- Best for: Product teams at companies with a dedicated analyst or the appetite to build one, tracking behaviour rather than page views.
- Pricing: Free for 2M events/month. Plus starts at $0 and scales to 70M events. Growth and Enterprise are custom, event-based. Verified in July 2026.
- The honest catch: Growth and Enterprise have no published pricing at all, and reviewers report Amplitude costing two to five times Mixpanel at equivalent usage.
What Is Amplitude?
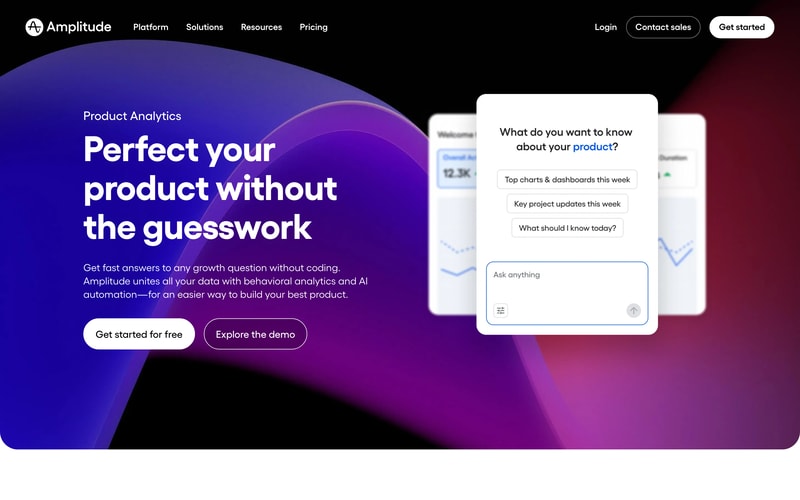
Amplitude is a behavioural analytics platform, which is a meaningfully different thing from web analytics. Google Analytics tells you how many people visited a page. Amplitude tells you which sequence of actions preceded a conversion, which cohort of users retained after a feature launch, and where in a multi-step flow people abandon.
The customer list reflects the seriousness of the tooling: Atlassian, Square, Zoom, Qualtrics, and Gong all appear on its pricing page. This is a product built for teams that treat product decisions as analytical questions.
In 2026 Amplitude has added AI Agents with Model Context Protocol support, session replay, and, like several other products in this catalogue, AI Visibility prompt tracking. That last addition is notable: Semrush, Surfer, Writesonic, and now Amplitude have all built AI-search visibility into products that previously had nothing to do with it.
The independent rating is good on a modest sample, at roughly 4.6 out of 5 on Capterra across 67 reviews.
How Amplitude Works
- Event-based tracking. Every user action, a click, a page view, a signup, a purchase, is an event. This is the billing unit and the analytical unit.
- Cohorts and retention. Behavioural cohorts, retention curves, and funnel analysis are the core, and where Amplitude clearly beats general web analytics.
- Session replay. 10,000 monthly replays even on free, rising to 50,000 on Enterprise.
- Experiments, guides, and surveys. Included in limited form on free, expanding with tier.
- AI Agents and MCP. Available on every plan including free, letting AI assistants query your analytics directly.
- Governance. SSO and project permissions on Growth, data access controls and RBAC on Enterprise.
Amplitude Pricing
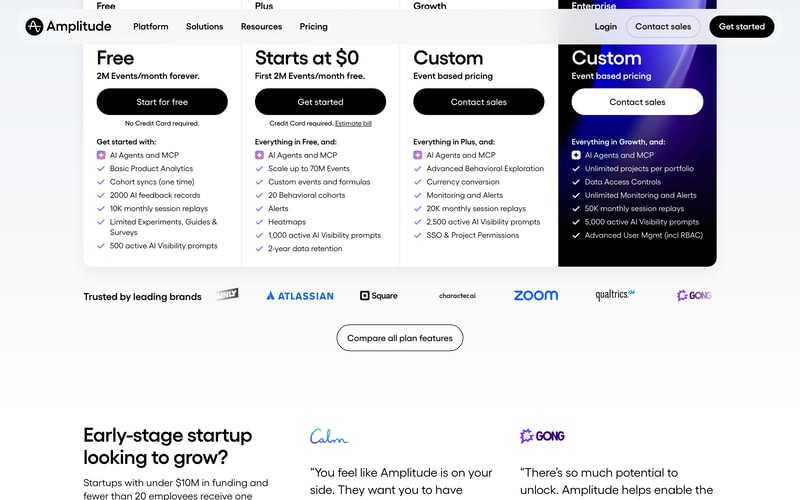
Four tiers, two of them unpriced. Figures verified on Amplitude’s pricing page in July 2026.
| Plan | Price | Events/month | Session replays | Notable |
|---|---|---|---|---|
| Free | $0 forever | 2M | 10,000 | AI Agents and MCP, basic analytics, 500 AI Visibility prompts, no card required |
| Plus | Starts at $0 | Up to 70M | 10,000 | Custom events and formulas, 20 behavioural cohorts, alerts, heatmaps, 2-year retention. Card required |
| Growth | Custom | Event-based | 20,000 | Advanced behavioural exploration, monitoring, SSO and project permissions |
| Enterprise | Custom | Event-based | 50,000 | Unlimited projects, data access controls, RBAC |
What determines what you pay:
- Events are not users. One person in one session can generate dozens of events. A product that ships more instrumented features generates more events from the same audience, which is why reviewers describe cost rising faster than headcount or revenue. This is the single most important thing to internalize.
- 2 million free events is genuinely generous. For an early-stage product it can last a long time, and it is a real free tier rather than a trial.
- Plus “starts at $0” is usage pricing, not a free plan. The first 2M events are free, a credit card is required, and beyond that you pay by volume. Amplitude provides a bill estimator, which is worth using rather than guessing.
- Growth and Enterprise are unpriced. Reviewers specifically note that opaque pricing at those tiers forces sales conversations smaller teams would rather avoid.
- Cost at scale is the dominant complaint. Reviewers across multiple platforms report Amplitude costing two to five times Mixpanel for equivalent usage.
- The startup scholarship is worth knowing about. Companies with under $10M in funding and fewer than 20 employees can get a free year of the Growth plan, which is a substantial offer and not widely publicized.
Who Should Use Amplitude
- Product teams making behavioural decisions. The clearest case. Retention analysis, cohort behaviour, and funnel diagnosis are what this tool is for.
- Early-stage products. 2M free events plus the startup scholarship makes Amplitude close to free for a company that qualifies.
- Teams with analytical capacity. Reviewers consistently report a two-to-four-week ramp, so this rewards teams with someone who owns analytics.
- Companies already instrumented for events. If your product emits structured events, Amplitude turns them into answers quickly.
It fits poorly for teams wanting simple traffic reporting, where Google Analytics or Plausible cost nothing and answer the question, for organizations needing predictable budgets, given usage-based pricing on an unpredictable meter, and for teams without an analyst, since the learning curve is real.
Honest Pros and Cons
Strengths
- A genuinely generous free tier. 2 million events a month forever, with no card, including session replay and AI agents.
- Best-in-class behavioural analysis. Cohorts, retention, and funnels handled better than in general analytics tools.
- The startup scholarship. A free year of Growth for qualifying early-stage companies is a serious offer.
- AI Agents and MCP on every plan. Including free, which lets assistants query analytics directly.
- Session replay included from free. 10,000 monthly replays at no cost is unusual.
- Credible at scale. Atlassian, Square, Zoom, and Qualtrics are reference customers for a reason.
Limitations
- Event-based pricing is hard to forecast. Volume tracks features shipped rather than users acquired, and reviewers report costs arriving sooner than expected.
- Growth and Enterprise are unpriced. No published figures, so evaluation requires a sales conversation.
- Expensive at scale. Reported at two to five times Mixpanel for equivalent usage, and cited as the top complaint across review sites.
- A steep learning curve. Two to four weeks for teams to become productive, and longer for non-technical users.
- Needs an owner. Meaningful dashboards require deliberate configuration, which is difficult without a dedicated analyst.
- A modest review base. 67 Capterra reviews is thin, though the enterprise customer list carries its own weight.
Amplitude Alternatives and How It Compares
- Mixpanel is the direct competitor and is consistently reported as considerably cheaper at equivalent volume, with somewhat less analytical depth.
- PostHog is the open-source option, self-hostable, with a generous free tier and a broader product suite.
- Google Analytics is free and answers traffic questions rather than behavioural ones. Most teams need both rather than one.
- Semrush and other SEO platforms cover acquisition rather than in-product behaviour, and complement rather than compete.
- Heap competes on automatic event capture, which removes some instrumentation work at the cost of data hygiene.
For a broader view, browse our product analytics directory.
The Verdict
Amplitude is the strongest behavioural analytics platform available to most teams, and its free tier is unusually good: 2 million events a month forever, with session replay and AI agents included, is a real product rather than a demo. For an early-stage company, particularly one that qualifies for the startup scholarship and its free year of Growth, the economics are close to unbeatable.
Understand the meter before you commit, though. Amplitude charges by events, and events grow with what your product does rather than with how many customers you have. Teams repeatedly report the same experience: a feature launch increases instrumentation, event volume climbs faster than user count, and a procurement conversation arrives months before anyone had budgeted for it. Use the bill estimator with a realistic forecast of your instrumentation, not your traffic.
Two further cautions. Growth and Enterprise carry no published pricing at all, so comparison requires a sales process, and reviewers report Amplitude running two to five times Mixpanel’s cost at equivalent usage. And budget two to four weeks of ramp: this is a tool that rewards a dedicated owner and frustrates teams hoping for insight without configuration. If you have that person, it is excellent. If you do not, you will pay for capability you never reach.
FAQ
How does Amplitude count events?
An event is any tracked user action: a button click, a page view, a signup, a purchase. One user in one session can generate many events, and a single monthly tracked user can generate dozens across a month. Crucially, event volume grows as you instrument more of your product, so shipping features increases your bill even if your user count is flat.
Is Amplitude’s free plan actually free?
Yes, and generously so. The Free plan includes 2 million events per month forever with no credit card required, plus 10,000 monthly session replays, basic product analytics, AI Agents with MCP, and 500 active AI Visibility prompts. It is a working tier rather than a trial. Note that the Plus plan, which “starts at $0”, is different: it gives the first 2M events free but requires a card and charges by usage beyond that.
How much does Amplitude cost at scale?
Amplitude does not publish pricing for its Growth and Enterprise tiers, both of which are event-based and quoted through sales. Reviewers across multiple platforms report Amplitude costing roughly two to five times Mixpanel for equivalent usage, and expensive pricing at scale is the most commonly cited complaint.
Does Amplitude offer anything for startups?
Yes, and it is not widely publicized. Companies with under $10 million in funding and fewer than 20 employees can receive one free year of the Growth plan through Amplitude’s startup scholarship. For a qualifying early-stage team that is a substantial saving and well worth applying for before paying for anything.
Is Amplitude hard to learn?
Reasonably, yes. Reviewers consistently describe a two-to-four-week ramp before teams feel productive, with non-technical users at the longer end, and note that meaningful dashboards require deliberate configuration. It rewards teams with a dedicated analytics owner and disappoints those expecting insight without setup work.

Compare Amplitude Analytics with other popular tools in the same category.
Go beyond metrics like pageviews and clicks. See every path users take in a single view and zoom in to understand the context and intent behind their actions.
360º-view of behaviors across the platform is not there
product analytics software for web and mobile
MAU, DAU metrics, Open rates, Figuring out user metrics
Complexity of things, look at clevertap how easy it is to navigate, i feel the dashboard could be much easy to navigate
It was helping us understand where our users churn was happening and Store adoption rate brand wise data was being presented
That it tracks data we already have. It enables us to track data we already have so we can find new insights. That is incredible and so important in a software like this.
For my use case of identifying trends for clients to understand their product usage, it is overly complex and non-user friendly. Though it has a lot of potential, it is not that useful for my case.
It has the capacity to replace another tool I use. However, it must be stated that it is not a simple elegant solution so setup is complex and I hope it just works and never needs to be adjusted afterwards!
my favorite feature is being able to create cohorts and track performance along different campaigns.
I feel like the product is built for product & engineering teams and not an easy tool for marketing to pick up. I have difficulty with understanding how to split out tests and read the information - especially with holding events constant and when to do so.
I specifically use amplitude when reviewing a/b tests and marketing campaigns we're newly launching
The most interesting features that I use the most are: conversion funnels, retention and cohorts. Exporting to csv is a great tool that I also use to manipulate the data the way I need to. The magic also happens with compass and correlation, but the features still need development as it is hard to extract direct learnings from them.
The way event filtering works: We cannot be specific about user events when building cohorts: We can include all people that had event X where property is Y, but we will also have people with properties U, V, W... I have trouble filtering users by these events by working with the csv file. Another point is the pricing, where I think it is very hard to pay that amount of money when starting a project. Another point is when checking user events: It does not have the local time of the device which was problematic for an experiment that we had. Last but not least, the interface is very slow: if I move onto another tab, then back to the amplitude tab, it takes a very long to reload the content.
To analyse the growth of our App through continuous A/B testing. We have achieved great learnings about the flow of the app, what type of information the users care about, and how to create stickiness and love.
can track a lot of metrics and funnels - also like it shows by browser
UI is hard to use - hard to find one metric I'm trying to track, or track down an issue with a specific session
tracking on new features, effectiveness, clickthrough rate
Amplitude offers an incredibly easy to set up all (integration took maybe 2 hours assuming your data and events are instrumented properly), all - in - on analytics platform that will help you build tracking plans, help you run experiments, and help you start making data driven decisions early on in your product journey. Great for setting up daily or weekly view dashboards, and getting live in-the-moment metrics.
If you're new to data analytics, or don't have data-minded people in product/eng, amplitude will be a lifesaver. I think as a tool it would have been nonpareil for smaller companies five or ten years ago. The problem is that data literacy among most organizations has increased and Amplitude uiis being left in the dust when it comes to allowing organizations to ask quesitons that are different to what amplitude thinks is best. You can't freely browse and explore your data, you need to go through a convoluted process of picking their specific kind of chart, which has ridiculous limitations. Want to see a count of users with event property = X for a dashboard? Tough, you can only see it as a donut chart or bar chart. Want to see how that property evolves over time? Sorry, not supported. Want to build a cohort on the fly to filter out a specific segment? Sorry, have to go to the cohort page and click through 4 screens to get it done. The handholding and lack of flexibility is great when you're brand new to the concept of using data, but quickly becomes a burden when you want to anything more than the most rudimentary analysis, or when you want to answer a question that amplitude hasn't built a dedicated flow for. Customer support in the startup plans is also non existent. You'll have to ask community members for customer support, which can take days to get a response from.
Amplitude is helping our startup track early stage adoption numbers, feature engagement, and subscription/revenue retention. We run an AI powered companion service as a backend that plugs into partner websites. While we don't have frontend events from the partner websites, we use amplitude to report on all backend events which include things like: Average session chat time, messaging frequency, subscription rates (subscribe, renew, autorenew states), one-off purchases via the chat interface (these feed into metrics around upsell conversion rates and overall revenue numbers), and user retention and engagement over time.
RBAC is good and and integration with sources and destinations is seamless. It has straightforward usage. Wouldn't say there is one best thing. Amplitude does few things okay here and there.
I don't like the UI/UX compared to Mixpanel. Sometimes gets hard to understand. Events tracking and duplication algorithm also needs work. We had to spend hours trying to debug why there was a mismatch in events between Mixpanel and GA.
Helps us track user events and behaviour on our marketplace. We have understood a fair share about our product. I wouldn't say I'm more productive or it has significantly improved our business performance.
I like the flexibility of amplitude when it comes to app tracking. It gives you a ton of integration options and seems to be one of the more robust options in the app space.
The flexibility also makes it overly complicated. There is no standard way of implementing so it is what you make it. We have seen some very rough integrations that make me not want to work on the product. Other times and when it is more basic the data is valid and good. Short story don't overcomplicate it.
We needed tracking of some very specific app interactions and that is what led us to try Amplitude. We are using it for iOS and Android app interactions and product research.
I feel like there is a lot of data being collected that's really valuable. It gives me a much better view of our product than I would have had otherwise. The ability to create charts embedded in dashboards, which can then be embedded into team spaces is really powerful. It gives our teams data points for understanding engagement, rather than just guessing
I feel like, despite the volume of data collected, there are limitations to the things I can do with that data. For example, I'm not able to do much or any analysis with it. Also, some of the UI isn't the most intuitive, so setting up meaningful dashboards isn't always straightforward. I feel like I may benefit from some training but I'm not sure if there is an account manager for that.
We have multiple parts of our product. I'm using Amplitude to understand who is using which parts and how much. This is allowing me to see who key users are in our accounts, who the best people to approach are for getting feedback and to understand potential issues with our product that need to be addressed
Better user interface than some of the other analytics products
Extremely complicated to set up and even debug on an ongoing basis.
Consumer analytics to understand funnels etc
The only thing I really like is the design with the rounded edges.
The UI itself is not very user friendly, but most importantly I wish we could use it within the marketing teams to track channel performance and users coming through different marketing channels. We've hacked something together, but it's incredibly limited.
Trying to track user behavior, but for myself it's specifically in reference to users coming through specific marketing channels.
Our business was able to gain a deeper insight into user behavior because of Amplitude Analytics. Amplitude Experiments has fundamentally altered the way we test and introduce upcoming features and assisted our product organization in being more data-driven in its decision-making. The tools provided by Amplitude are accessible, simple to use, and extremely powerful.
It's a tool that requires more accessible training materials, which delays adoption by other teams. Backfilling of data should be allowed. It feels slightly sluggish some times.
New feature adaptation. A/B testing results. Help us find out the churning reason. Help us figure out growth potential. Help us monitor traffic and thus we can optimize AWS infrastructure.