

Unclaimed: Are you working at Amplitude Analytics?
Amplitude Analytics Reviews: 4.5/5 — Highly Rated
Amplitude is an analytics tool designed to support businesses by helping them understand user behavior and giving them key insights that can help them improve their products. It offers tools such as behavior tracking, funnel analysis, as well as A/B testing that combines to help companies make data-driven decisions that optimize products and drive business growth.

| Capabilities |
AI
API
|
|---|---|
| Segment |
Small Business
Mid Market
Enterprise
|
| Deployment | Cloud / SaaS / Web-Based, Mobile Android, Mobile iPad, Mobile iPhone |
| Training | Documentation |
| Languages | English |



Amplitude gives you 2 million events a month free forever, and then prices on events rather than users, which is the detail that catches people out. Event volume grows with the number of things your product does, not with how many customers you have. Teams routinely discover that shipping features, not acquiring users, is what moves them into a procurement conversation.
- What it is: A product analytics platform for understanding user behaviour, with cohorts, funnels, session replay, and experimentation.
- Best for: Product teams at companies with a dedicated analyst or the appetite to build one, tracking behaviour rather than page views.
- Pricing: Free for 2M events/month. Plus starts at $0 and scales to 70M events. Growth and Enterprise are custom, event-based. Verified in July 2026.
- The honest catch: Growth and Enterprise have no published pricing at all, and reviewers report Amplitude costing two to five times Mixpanel at equivalent usage.
What Is Amplitude?
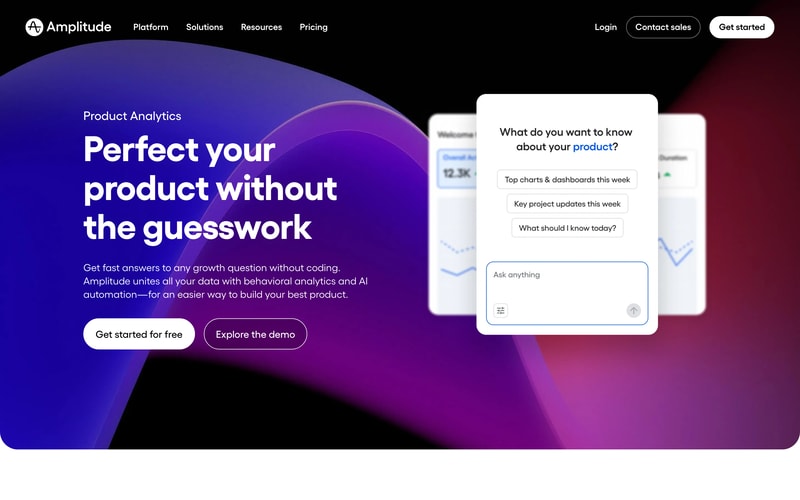
Amplitude is a behavioural analytics platform, which is a meaningfully different thing from web analytics. Google Analytics tells you how many people visited a page. Amplitude tells you which sequence of actions preceded a conversion, which cohort of users retained after a feature launch, and where in a multi-step flow people abandon.
The customer list reflects the seriousness of the tooling: Atlassian, Square, Zoom, Qualtrics, and Gong all appear on its pricing page. This is a product built for teams that treat product decisions as analytical questions.
In 2026 Amplitude has added AI Agents with Model Context Protocol support, session replay, and, like several other products in this catalogue, AI Visibility prompt tracking. That last addition is notable: Semrush, Surfer, Writesonic, and now Amplitude have all built AI-search visibility into products that previously had nothing to do with it.
The independent rating is good on a modest sample, at roughly 4.6 out of 5 on Capterra across 67 reviews.
How Amplitude Works
- Event-based tracking. Every user action, a click, a page view, a signup, a purchase, is an event. This is the billing unit and the analytical unit.
- Cohorts and retention. Behavioural cohorts, retention curves, and funnel analysis are the core, and where Amplitude clearly beats general web analytics.
- Session replay. 10,000 monthly replays even on free, rising to 50,000 on Enterprise.
- Experiments, guides, and surveys. Included in limited form on free, expanding with tier.
- AI Agents and MCP. Available on every plan including free, letting AI assistants query your analytics directly.
- Governance. SSO and project permissions on Growth, data access controls and RBAC on Enterprise.
Amplitude Pricing
Four tiers, two of them unpriced. Figures verified on Amplitude’s pricing page in July 2026.
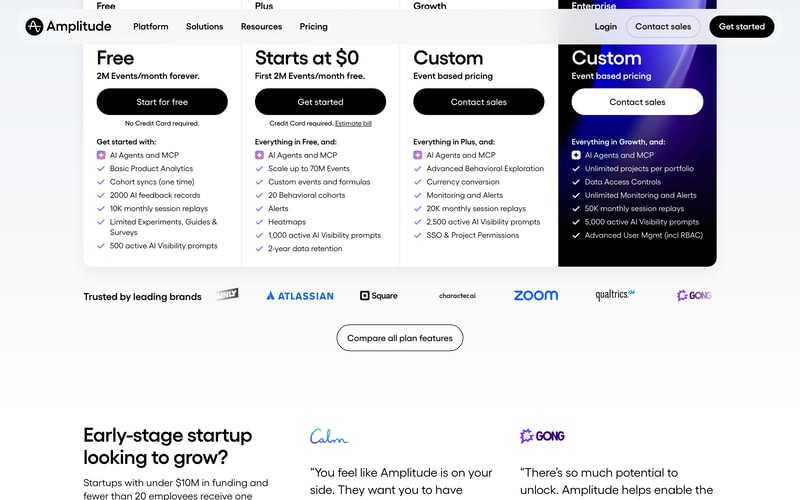
| Plan | Price | Events/month | Session replays | Notable |
|---|---|---|---|---|
| Free | $0 forever | 2M | 10,000 | AI Agents and MCP, basic analytics, 500 AI Visibility prompts, no card required |
| Plus | Starts at $0 | Up to 70M | 10,000 | Custom events and formulas, 20 behavioural cohorts, alerts, heatmaps, 2-year retention. Card required |
| Growth | Custom | Event-based | 20,000 | Advanced behavioural exploration, monitoring, SSO and project permissions |
| Enterprise | Custom | Event-based | 50,000 | Unlimited projects, data access controls, RBAC |
What determines what you pay:
- Events are not users. One person in one session can generate dozens of events. A product that ships more instrumented features generates more events from the same audience, which is why reviewers describe cost rising faster than headcount or revenue. This is the single most important thing to internalize.
- 2 million free events is genuinely generous. For an early-stage product it can last a long time, and it is a real free tier rather than a trial.
- Plus “starts at $0” is usage pricing, not a free plan. The first 2M events are free, a credit card is required, and beyond that you pay by volume. Amplitude provides a bill estimator, which is worth using rather than guessing.
- Growth and Enterprise are unpriced. Reviewers specifically note that opaque pricing at those tiers forces sales conversations smaller teams would rather avoid.
- Cost at scale is the dominant complaint. Reviewers across multiple platforms report Amplitude costing two to five times Mixpanel for equivalent usage.
- The startup scholarship is worth knowing about. Companies with under $10M in funding and fewer than 20 employees can get a free year of the Growth plan, which is a substantial offer and not widely publicized.
Who Should Use Amplitude
- Product teams making behavioural decisions. The clearest case. Retention analysis, cohort behaviour, and funnel diagnosis are what this tool is for.
- Early-stage products. 2M free events plus the startup scholarship makes Amplitude close to free for a company that qualifies.
- Teams with analytical capacity. Reviewers consistently report a two-to-four-week ramp, so this rewards teams with someone who owns analytics.
- Companies already instrumented for events. If your product emits structured events, Amplitude turns them into answers quickly.
It fits poorly for teams wanting simple traffic reporting, where Google Analytics or Plausible cost nothing and answer the question, for organizations needing predictable budgets, given usage-based pricing on an unpredictable meter, and for teams without an analyst, since the learning curve is real.
Honest Pros and Cons
Strengths
- A genuinely generous free tier. 2 million events a month forever, with no card, including session replay and AI agents.
- Best-in-class behavioural analysis. Cohorts, retention, and funnels handled better than in general analytics tools.
- The startup scholarship. A free year of Growth for qualifying early-stage companies is a serious offer.
- AI Agents and MCP on every plan. Including free, which lets assistants query analytics directly.
- Session replay included from free. 10,000 monthly replays at no cost is unusual.
- Credible at scale. Atlassian, Square, Zoom, and Qualtrics are reference customers for a reason.
Limitations
- Event-based pricing is hard to forecast. Volume tracks features shipped rather than users acquired, and reviewers report costs arriving sooner than expected.
- Growth and Enterprise are unpriced. No published figures, so evaluation requires a sales conversation.
- Expensive at scale. Reported at two to five times Mixpanel for equivalent usage, and cited as the top complaint across review sites.
- A steep learning curve. Two to four weeks for teams to become productive, and longer for non-technical users.
- Needs an owner. Meaningful dashboards require deliberate configuration, which is difficult without a dedicated analyst.
- A modest review base. 67 Capterra reviews is thin, though the enterprise customer list carries its own weight.
Amplitude Alternatives and How It Compares
- Mixpanel is the direct competitor and is consistently reported as considerably cheaper at equivalent volume, with somewhat less analytical depth.
- PostHog is the open-source option, self-hostable, with a generous free tier and a broader product suite.
- Google Analytics is free and answers traffic questions rather than behavioural ones. Most teams need both rather than one.
- Semrush and other SEO platforms cover acquisition rather than in-product behaviour, and complement rather than compete.
- Heap competes on automatic event capture, which removes some instrumentation work at the cost of data hygiene.
For a broader view, browse our product analytics directory.
The Verdict
Amplitude is the strongest behavioural analytics platform available to most teams, and its free tier is unusually good: 2 million events a month forever, with session replay and AI agents included, is a real product rather than a demo. For an early-stage company, particularly one that qualifies for the startup scholarship and its free year of Growth, the economics are close to unbeatable.
Understand the meter before you commit, though. Amplitude charges by events, and events grow with what your product does rather than with how many customers you have. Teams repeatedly report the same experience: a feature launch increases instrumentation, event volume climbs faster than user count, and a procurement conversation arrives months before anyone had budgeted for it. Use the bill estimator with a realistic forecast of your instrumentation, not your traffic.
Two further cautions. Growth and Enterprise carry no published pricing at all, so comparison requires a sales process, and reviewers report Amplitude running two to five times Mixpanel’s cost at equivalent usage. And budget two to four weeks of ramp: this is a tool that rewards a dedicated owner and frustrates teams hoping for insight without configuration. If you have that person, it is excellent. If you do not, you will pay for capability you never reach.
FAQ
How does Amplitude count events?
An event is any tracked user action: a button click, a page view, a signup, a purchase. One user in one session can generate many events, and a single monthly tracked user can generate dozens across a month. Crucially, event volume grows as you instrument more of your product, so shipping features increases your bill even if your user count is flat.
Is Amplitude’s free plan actually free?
Yes, and generously so. The Free plan includes 2 million events per month forever with no credit card required, plus 10,000 monthly session replays, basic product analytics, AI Agents with MCP, and 500 active AI Visibility prompts. It is a working tier rather than a trial. Note that the Plus plan, which “starts at $0”, is different: it gives the first 2M events free but requires a card and charges by usage beyond that.
How much does Amplitude cost at scale?
Amplitude does not publish pricing for its Growth and Enterprise tiers, both of which are event-based and quoted through sales. Reviewers across multiple platforms report Amplitude costing roughly two to five times Mixpanel for equivalent usage, and expensive pricing at scale is the most commonly cited complaint.
Does Amplitude offer anything for startups?
Yes, and it is not widely publicized. Companies with under $10 million in funding and fewer than 20 employees can receive one free year of the Growth plan through Amplitude’s startup scholarship. For a qualifying early-stage team that is a substantial saving and well worth applying for before paying for anything.
Is Amplitude hard to learn?
Reasonably, yes. Reviewers consistently describe a two-to-four-week ramp before teams feel productive, with non-technical users at the longer end, and note that meaningful dashboards require deliberate configuration. It rewards teams with a dedicated analytics owner and disappoints those expecting insight without setup work.

Compare Amplitude Analytics with other popular tools in the same category.
Easily to track events in the app, easy to make quick graphs, funnels. Easy to share with team members and set up workspaces.
Sometimes it's hard to set up certain types of graphs. It seems like maybe amplitude can do even more than what I utilize it for, so tutorials would be nice.
Helping track user events and test the effectiveness of a/b tests.
Seeing how individuals use our Saas platform within each component/solution.
Recreating multiple reports to see data.
Customer usage information that can tie back to the value of our platform to our customers.
You get to see clients if they are truly using our products and how much they are using them.
Maybe we don't have this function, but I think it will be nice if amplitude notifies us when one big account have a big drop in usage of our products.
We get to see clients if they are truly using our products and how much they are using them so that us CSM can provide accurate suggestions for the clients.
I like the ability to see all the info surrounding an email account that has accessed our site, what they looked at last, when they last logged in, and how long they've spent on our site in total. I also love that you can compile analytics based on each email domain which is helpful for data tracking.
I hate that the user lookup is case sensitive. We have clients that sign in with the same account but sometimes capitalize parts of their name, which makes it hard to track accurately a user's entire user history. I also hate that for some of the analytics tools that you can only select dates as an entire week, so instead of choosing the first of the month, if it lands on a "not acceptable" date, you would have to either select the Monday that starts that week or choose to start the analytics the following monday. This messes with analytics and is annoying. Also hate that if someone uses ad blockers that we don't have information on that account.
Amplitude helps us track which users from a domain are actively using our site, which helps us reach out to those users that haven't been as active on our site. We also get to see what parts of our site get the most activity, which can help determine which features we spend more time on for upgrades.
The ease of switching from funnel to segmentation and to flow to understand the customer behaviour within product experience.
The sharing capabilities especially with cohorts is limited and the ability to create a cohort from a report and share is not allowed.
We understand how our customers are using our products and allow us to go deep with insights and understanding the abandonment occuring.
- It is super easy to build and share dashboards - Easy to analyze A/B test results
- Not able to visualizing user paths when only properties differ - Limited graph options
- App usage analisys - App A/B testing - CAC / Conversion
- helpful support team - some of my needs/questions are anticipated and already answered in the tool - I'm able to quickly create charts for experiments, not much customization needed - new URLs are saved per edit
- works best when you already know quite precisely what you're looking for and you have an engineer or savvy teammate to contact for questions - calc is abstracted away from the chart creator... it can be easy to get things wrong if you don't actually work with data much or if you normally write very precise SQL and need this to do the same - related to last bullet, it's hard/impossible to filter or grab related info about an event or a user the way you would from SQL table joins. It has to exist as an event or user property already. - stale/unused events come up as suggestions as much as highly used events
- Experimentation that led to users' increased usage of product or locating bugs before rolling out a feature to 100% of users - General understanding of user behavior, funnel progression, and frequency of using parts of site/product - Checking for potential bugs - able to notice spikes or drops in certain events as a non-engineer and flag to the right team
I like the fact that we are able to effectively track user journeys and paths across the site
I dislike the fact that the onboarding process wasn't that seamless and that some of our marketing team (including myself) don't feel skilled-up enough to make some more informed decisions
We have solved so significant issues of users getting stuck within our website, or those that are going around in circles - when it should be a straightforward process.
Interface is easy to understand and use. Chart presentation is user-friendly for non data professionals or someone who is not familiar with the software.
1. SQL editor is not comfortable to use: the code window is too small, there are no IDE-like code suggestions, and if the error occurs, you are on your own - the error message is not helpful at all. 2. The chart size (y-axis) can not be set up for decimals or percentages (although the percentage feature is presented - it just does not work), only for whole numbers. 3. The notebooks and dashboards start to behave strangely starting from some size: the page is automatically scrolled down when holding a chart to move, making it impossible to move the chart up or place it along with some other chart (in a notebook). 4. The loading time of big dashboards, notebooks and sometimes even regular charts is soooo long. 5. The reports automatisation! There were posts from the Amplitude team about routine automatization, but the suggested services do not support Amplitude. The export feature is not sufficient for report automatization. The data is not aggregated in any way (or it is not documented, how to do so), and the charts data can not be exported at all, just raw events. It is very time-consuming to look through the same charts every day to make a report, this definitely should be automated, but the platform makes it impossible to implement adequately.
Players retention, app revenue, players behaviour and features.
Funnel view across all screen and tracking events
Not having a trend for funnel drop-offs for day wise. Have limited more insight visibility for funnel.
To gauge activation, retention and engagement. Have been able to see potential improvement required basis user journey and where there is break
The ease of use to quickly create charts and the responsiveness of the platform
The chart's limitation to custom formulas and other useful chart types that are suitable for time-of-day analysis
We're getting a high-level view of our user's behaviour.
Easy to use, can pull reports for different events and cohorts of users.
Can be slow to build out a cohort, when there's a big audience.
Understand how campaigns perform.
The pseudocode style of building charts is very easy to understand.
Permissioning options need to be expanded. It is difficult to make dashboard-level changes to all charts once initial setup is complete.
I use it to track customer usage of our platform for identifying the impact our service consultants are making and understand client business cycles.
Performance is usually pretty solid even for charts with many events
Very limited functionality for controlling how to display the events. Hard to aggregate or create charts that aren't specifically targeting the UserId field. Also, the histogram charts auto bucket sizes aren't great, but if you try to set your own you don't get an option to have a last bucket that catches the rest of all the values like the auto size does.
We mainly use it to track user engagement in our platform's various functionalities. We also use it for some operational metrics to graph out query response times as well as realtime system performance charts.
Creating charts for different product areas. For e.g. retention, acquisition, conversion
Session data relies on how Amplitude classifies a user session. There isn't an easy way to understand session duration, time between user sessions.
Helping me understand conversion, usage and acquisition metrics mostly
The dedup feature could be pretty useful
When trying to drop some events, we can only specify one filter expression but do not support multiple filters, which is not super useful
AB testing, a much shorter cycle to get insights.
I really like the exploratory analysis in Amplitude, and the low learning barrier for quickly creating charts.
One of my main use cases for Amplitude is understanding certain user flows. It'd be great if your dashboards could be easier to parameterize (like i want all my charts to filter on this one user id).
For the internal company tool I work on, I get a lot of clarity on which features I should focus on, and which I should ignore. So in a word: user impact.
Easy to understand and set up charts, dashboards, and cohorts for top-level reporting and analysis.
Lacks the ability to perform much beyond basic queries and visualizations. Wish there was more flexibility / more templates.
Great at quickly constructing dashboards to monitor top level metrics and performance.
Amplitude is pretty comprehensive when it is setup correctly.
It's hard to know which metrics map to different actions. A data dictionary tool would be helpful.
We're answering important questions about our business that relate to the economics and product analytics.
Amplitude allows you to grab the data cuts you need with minimal overhead and a basic understanding of event-based data collection. It can do many of analyses you need and, with some additional customization, most of the data you want to pull.
Monthly cohorting as defined by some metric is such a standard, consistent need in any analysis and I still have to enter start and end dates over and over again for any cohorted analysis I need to run - especially when doing cohorted retention data.
We're doing feature and usage-based analyses, cohorted retention analyses, funnel analyses, and general data pulls. We've been able to answer questions more quickly and set up data-informed discussions more regularly.
Amplitude provides complex analytical graphs to be created by end-users that would otherwise be extremely cumbersome to do with SQL.
Amplitude analytics has a relatively steep learning curve for end-users, and training resources are not always helpful. It also requires strong data governance.
How to retain users, understanding which critical events drive users back to our site. Using the stickiness graphs, we identified two critical events which drive retention.
Segmentation, user properties, creating charts that make sense. Having a written description below the charts is really helpful. Dashboards for checking health metrics is great. Disabling events on the fly is awesome and can cut costs a lot. Comparison feature is also nice + the fact that there are a lot of options when it comes to formulas.
The flow to create charts is really weird. I have to press many buttons. Creating a new dashboard is so hidden I was searching for t for 5 minutes today. I am not happy with the Start Session event. Its just not working properly on iOS 15 and we had to create our own CustomSession event which works. We have validated it many times but it looks like this event should not be used. on iOS 14 it was working properly, but with iOS 15 it fires even when the app is sleeping at night as iOS calls didFinishLaunching and it looks like they send events there. This caused our Product team to get really happy in September. Then we realized its fake sessions :) Some smaller bugs on the graphs where it says there are 5 users experiencing an issue and then you realize its 1 user with 5 events. I would love if I could write a custom query as well for my data. (and it would show it on a dashboard)
I am mostly investigating user issues, when they send a diagnostics report I am able to see high level events for the user which I can use to validate hypothesises.
Multiple Integrations & ability to visualize various events as needed.
1. Certain charts are a little tricky to use 2. Certain Functions can't be perfomed
1. Understanding Daily Product Performance Metrics 2. Taking away business insights around what to improve on
As the user journeys become more complex, growth analytics in SaaS are becoming more difficult as well. Thanks to the import feature with Segment, we have consistent and flexible data in Amplitude, which we use daily to understand insights & intent levels.It's also easy to use and onboard new people, even in remote-first settings.
Some of the newer charts are harder to implement as you're working with your own custom product data. Also, it would be great to annotate on charts to drop notes about the context and aggregate both quantitative and qualitative insights together.
We use it on all possible ways, including aggregating paid ads' conversion data and monitoring growth channels separately. Using Amplitude, I'm able to observe the entire funnel and act accordingly. As a growth marketer, every working day it's one of the first Chrome tabs to open and probably to last to close for me.
I love the speed with which the data is being pulled. I love the User look up feature that allows me to track all the app events live.
In some cases, the use of the features is not at all obvious and requires some back and forth with the support to understand the exact functionality. E.g. exclusion in the funnel chart.
Any experience related questions on our app.
Amplitude with its Intuitive GUI ensures its usable by everybody in the team and not just "data analysts" Clickstream funnels which are extremely difficult using traditional querying
There could be a more prominent knowledge bank to help users onboard faster and scale the existing users to advanced concepts Some crucial functionalities are absent, for Ex; Joins
Funnel analysis User monetization Lower time to insight
Amplitude help us to understand our users. cohorts ,notebook are the best and often used feature in Amplitude Lifecycle help us to understand user type . Retention help us to know churn and retention over period of time , without manual calculation. User sessions and funnel analysis help us to understand the user session length this help us to know engagement time of users , whereas funnel analysis help us to know the drop off points and conversion rate of each step.
limitation of downloading the users . even after using API , can only download in json format . than we have to work to convert json to csv . looking for some easy export process. another dislike is - in dashboard we cannot customize dates . should have some dashboard feature where we can combine data from multiple sources , for eg some of our data is in Mysql database and some in Amplitude. it require manual efforts to generate combine dashboard from multiple sources currently we are using google sheets ,excels. This I will not say dislike - but one of the feature request , if Amplitude can help us with heatmap features ,which can help us to know where user hover,scroll or click in our platform to better understand user experience .
Amplitude help us to understand our users . key KPI like - user behavior , stickiness ,cohorts,bounce , churn , returning users and many others are easily calculated and can drive by Amplitude Analytics Amplitude made analysis easy for us and our management can also view and create chart on adhoc basis .
Love the easy ability to create funnels, see user retention patterns, analyze individual user streams
The lack of clean tools to play with attribution or pull in marketing spend data limits LTV analysis
we look short and/or simple paths of behavior on our site and and get quick answers for any set of events instrumented on our site.
Speed at which charts can be created and the extent of the use cases you can cover with the simple charts. Very easy to use. SQL traits have also meant that we can really use Amplitude for a lot of analysis.
Amplitude is not suitable for complex use cases and graphs, and sometimes it can be easy for non-data people to misunderstand what a chart is actually showing them.
Funnel analysis is much faster and reduces the development time by multiple fold, and also allows non-data people to self-service their analytics, day to day and
Graphs to plot, cohorts export to s3 bucket
API documentation is very limited and lacks samples
Customer usage pattern great learning