

Databox Reviews: 4.4/5 — Solid Choice
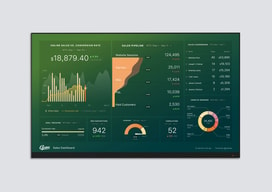
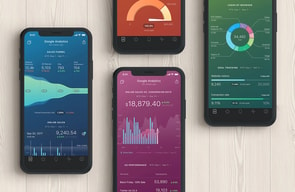
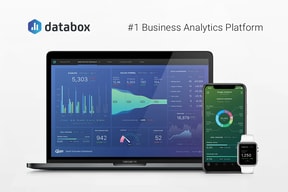
Databox is a cloud-based business analytics tool that lets users create custom analytics dashboards incorporating data from multiple sources, viewable from any device. The platform is specifically designed for high-level executives, analysts, and marketers, and makes navigation easy through single-click integrations, the advanced settings for unique metrics, and time intervals that can be modified and tailored to your needs.

| Capabilities |
API
|
|---|---|
| Segment |
Small Business
Mid Market
Enterprise
|
| Deployment | Cloud / SaaS / Web-Based, Mobile Android, Mobile iPad, Mobile iPhone |
| Support | 24/7 (Live rep), Chat, Email/Help Desk, FAQs/Forum, Knowledge Base, Phone Support |
| Training | Documentation |
| Languages | English |



Databox’s Analyst plan costs $64 a month and includes 5 data sources. Pro costs $159 and includes 3. Growth costs $399 and includes 3 — the same as the free plan. Data sources are the thing a dashboard tool connects to, and on the business tiers they do not scale with price at all. What the money buys is unlimited users and AI credits; extra sources are sold separately at $5.60 a month each — or $2.40 if you buy the identically priced agency plan instead.
- What it is: A dashboard and business analytics platform pulling metrics from many sources into one view.
- Best for: Teams needing unlimited users; agencies should use the agency tab regardless.
- Pricing: Free $0; Analyst $64, Pro $159, Growth $399 per month billed annually. Verified July 2026.
- The honest catch: Additional data sources cost 133% more on business plans than agency plans.
What Is Databox?
Databox builds custom analytics dashboards from data across many tools — marketing, sales, finance and support — viewable on any device, with AI features (Genie, an MCP server, forecasting) layered on top. It claims more than 20,000 companies and holds a 4.5-star average across 184 Findstack reviews.
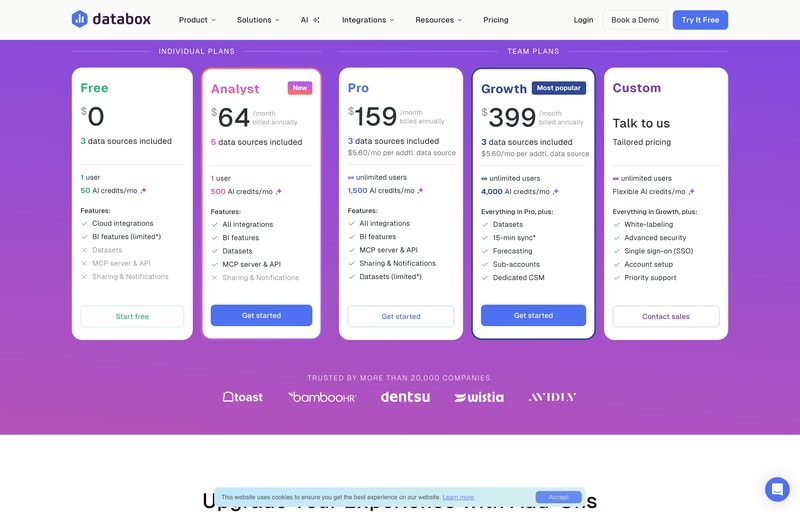
The page splits into Plans for Businesses and Plans for Agencies, with a 14-day free trial of Growth to start.
How Databox Works
- Two meters — data sources and AI credits.
- Sources do not scale with the business tiers.
- Extra sources are sold per month, at two different rates.
- Unlimited users from Pro upward.
- Annual billing saves about 20%.
- Agency plans cost the same but include more.
Databox Pricing
Captured from Databox’s pricing page in July 2026 in US dollars, reading both billing toggles and both tabs.
| Business plan | Monthly | Annual | Saving | Sources | Extra source | Users | AI credits/mo |
|---|---|---|---|---|---|---|---|
| Free | $0 | $0 | — | 3 | — | 1 | 50 |
| Analyst | $79 | $64 | 19.0% | 5 | — | 1 | 500 |
| Pro | $199 | $159 | 20.1% | 3 | $5.60/mo | Unlimited | 1,500 |
| Growth | $499 | $399 | 20.0% | 3 | $5.60/mo | Unlimited | 4,000 |
| Custom | Quoted | Quoted | — | — | — | Unlimited | Flexible |
| Agency plan | Annual | Sources | Extra source | Client accounts | AI credits/mo |
|---|---|---|---|---|---|
| Agency Starter | $79 | 3 | $2.40/mo | 5 | 500 |
| Agency Pro | $159 | 3 | $2.40/mo | Unlimited | 1,500 |
| Agency Growth | $399 | 3 | $2.40/mo | Unlimited | 4,000 |
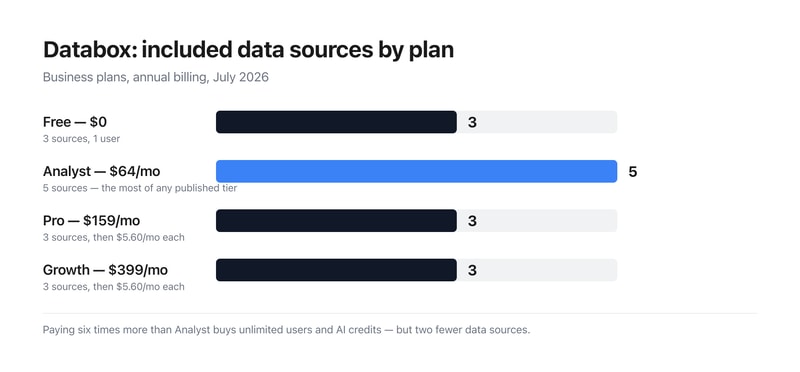
What actually decides your cost:
- Included data sources go 3, 5, 3, 3 as the price goes 0, 64, 159, 399. The cheapest paid plan includes the most sources of any published business tier, and the $399 plan includes no more than the free one. Sources are the primary thing a dashboard product connects to, so anyone scanning the cards would reasonably expect them to rise. What Pro and Growth actually buy is unlimited users and larger AI credit pools; connecting more data is a separate line item.
- The same extra source costs $5.60 on business plans and $2.40 on agency plans — 133% more. Both tabs sell identical add-on capacity at different rates. Reaching 10 sources costs $198.20 a month on Pro ($159 plus seven at $5.60) against $175.80 on Agency Pro ($159 plus seven at $2.40) — a $22.40 monthly difference on the same $159 base.
- Agency Pro and Pro cost exactly the same and Agency Pro includes more. Both are $159 a month with 1,500 AI credits, 3 sources and unlimited users. Agency Pro adds unlimited client accounts and the cheaper source rate. If your work qualifies, there is no configuration where the business tab is the better buy at that price.
- Analyst is single-user, which is the constraint that defines it. Five sources and 500 AI credits for $64 is reasonable, but one seat. The jump to unlimited users is Pro at $159 — a 148% increase — and it comes with two fewer included sources, so budget the add-ons alongside it.
- AI credits scale properly, if modestly. 50, 500, 1,500 and 4,000 a month across the tiers works out at $128 per thousand credits on Analyst, $106 on Pro and $99.75 on Growth — a real but shallow volume discount of about 22% across the range.
- The 20% annual saving is essentially accurate. Pro saves 20.1% and Growth 20.0%; Analyst comes in slightly under at 19.0% ($79 to $64). Add-ons are quoted “billed annually” separately, including branding and white-labeling, 15-minute sync, a fiscal calendar and advanced security management.
Who Should Use Databox
- Agencies. The clearest case — unlimited client accounts and half-price sources at identical headline prices.
- Teams needing unlimited seats. Pro at $159 is where user limits disappear.
- Solo analysts. Analyst at $64 has the most included sources of any paid business tier.
- Heavy AI users. Growth’s 4,000 monthly credits are the cheapest per credit.
It fits poorly for businesses connecting many sources, where the per-source charge compounds; for buyers who assume higher tiers include more data; and for single users needing more than five sources, since Analyst publishes no add-on rate.
Honest Pros and Cons
Strengths
- A permanent free plan with 3 sources and 50 AI credits.
- Unlimited users from Pro upward.
- Agency plans at identical prices with more included.
- A 14-day free trial of the Growth plan.
- An MCP server and API on every tier including Free.
- Around 20% off for annual billing.
Limitations
- Growth includes the same 3 sources as the free plan.
- Analyst has more sources than plans costing 6× as much.
- Extra sources cost 133% more on business than agency plans.
- Analyst is single-user and publishes no source add-on rate.
- Datasets are limited on Pro despite being full on Analyst.
- White-labeling, fiscal calendar and 15-min sync are paid add-ons.
Databox Alternatives and How It Compares
- Klipfolio is the closest competitor on custom dashboard building.
- Geckoboard focuses on simple, TV-friendly team dashboards.
- Looker Studio is free and strong if your data is already in Google’s ecosystem.
- Power BI and Tableau are the enterprise BI platforms, deeper and considerably more complex.
The Verdict
Databox does something genuinely useful — pulls metrics from across a business into dashboards anyone can read, with a free tier that includes the API and MCP server rather than holding them back. Unlimited users from Pro upward is the right call for a reporting tool, since the people reading dashboards usually outnumber the people building them, and per-seat pricing punishes exactly the behaviour the product wants to encourage.
The structure worth understanding before choosing is that the price ladder and the data source ladder are unrelated. Free includes 3 sources, Analyst at $64 includes 5, Pro at $159 includes 3, and Growth at $399 includes 3. The cheapest paid plan carries the most included sources of any published business tier, and the most expensive carries no more than free. That is not a mistake so much as a deliberate separation — Pro and Growth sell unlimited users and AI credits, with connections priced separately at $5.60 a month each — but it inverts the natural reading of a pricing page, and it means the sticker price is not the cost. Ten sources on Pro is $198.20 a month, not $159.
The sharper point is the difference between the two tabs. Agency Pro costs exactly the same $159 as Pro, carries the same 1,500 AI credits, the same 3 sources and the same unlimited users — and adds unlimited client accounts plus extra sources at $2.40 rather than $5.60, a 57% lower rate for identical capacity. At ten sources that is $175.80 against $198.20 for the same underlying product. Anyone whose work plausibly counts as agency work should check the agency tab before buying from the business one, because at these prices the business tab is never the better deal.
FAQ
How much does Databox cost?
In US dollars captured July 2026: Free is $0, Analyst $64 per month billed annually ($79 monthly), Pro $159 ($199) and Growth $399 ($499), with Custom quoted. Agency plans run $79, $159 and $399 annually. All plans start with a 14-day free trial of Growth.
How many data sources does Databox include?
Three on Free, five on Analyst, three on Pro and three on Growth — so included sources do not increase with price on the business tiers. Pro and Growth sell additional sources at $5.60 per month each; Analyst publishes no add-on rate. Agency plans include three sources and charge $2.40 per additional source.
Should I use Databox’s business or agency plans?
If your work qualifies as agency work, the agency tab, without question. Agency Pro and Pro both cost $159 a month with the same 1,500 AI credits, three data sources and unlimited users — but Agency Pro adds unlimited client accounts and charges $2.40 per extra data source instead of $5.60, a 57% lower rate for identical capacity.
What do Databox’s AI credits cover?
Genie and the MCP server, plus generating insights, building dashboards and asking questions about your data — all drawing from a shared monthly pool. Allowances are 50 on Free, 500 on Analyst, 1,500 on Pro and 4,000 on Growth, which works out at $128, $106 and $99.75 per thousand credits on the three paid tiers. A credit top-up add-on is listed as coming soon.
Does Databox charge per user?
Only on the entry tiers. Free and Analyst are limited to one user; Pro, Growth, Custom and all three agency plans include unlimited users. That makes Pro at $159 the point where seat limits disappear — a 148% increase over Analyst, though it includes two fewer data sources.

Compare Databox with other popular tools in the same category.
The platform is set up in a way that makes it very easy to connect your various data points before then building out your very own customized data walls and mobile reports.
It can be a little daunting starting your first few data walls and mobile reports. The building can be a bit overwhelming so someone who hasn't had a lot of time training and poking around in it.
While not adding any more reporting functionality than most any of your other platforms that have reporting included, Data Box does an incredible job taking all of that data and building out an integrated report to showcase how everything is connected and affecting each other. We've been able to finally pull in marketing, sales and customer service information all into one place and visualize it in a way that works for the different members of our team in an automated fashion! No more manual report generation for us!
Sure I could be looking at this on my own Google analytics dashboard, but it brings in everything I need all at once, at a glance. If it's not a day where I intend to spend time looking at certain pieces of data, I love that I still have the peace of mind knowing how my topline numbers look. I love aggregation services, and this is comprehensive and advanced.
I don't think it's incredibly simple to set up for you average user, but I feel very comfortable with technology and I found it intuitive. I can imagine a less-advanced user asking for assistance in setting up a Datacard or Datawall, and then sending it out to people they'd like to inform, as a nice concise data report. But I personally find the drag and drop and fill in the blanks set up a great way to decide what data you want to see.
Too much data in too many places and a difficult time using it to tell a story. I think it helps me visualize the story I'm trying to send. I'm a storyteller, and I often have a hard time with numbers and been analytical and data-minded. I think this helps keep me familiar with the numbers most important to me by keeping my narrative up to date and in my face, with their morning push notification of my updated datacard!
The best part about databox is that I don't have to work on the raw data to prepare dashboards for my organization. Databox integrates with other softwares like QuickBooks Online or Sendgrid and pulls all the data, syncs, and prepares dashboards. It gives the option to either use their pre-built templates or one can custom-choose the metrics. Customer support is otherwise good and prompt. We use this to create dashboard for our customers to view metrices on daily basis.
The pre-built templates are easy to use and implement however if any custom metrics needs to be created, it becomes a bit complex at times. They do provide 3 onboarding sessions but I am afraid as it would not cover all the uses of the software.
Default QuickBooks online does not provide an in-depth dashboard. To use data, we need to export in excel manually and then prepare pivot tables. Using Databox gives us an instant dashboard with in-depth analysis, which we sometimes tend to ignore. Now I have a dashboard that sync by itself. Another problem it solves is to share the dashboard with our clients with a user level access so that they dont see what they are not suppose to. It has saved us lot of time in creating dashboards by ourselves.

What I liked was the integration part where we can collect the data from various platforms and it has in-built templates which pull out the data easily. We can make a dashboard within a few minutes without any struggles.
Sometimes some formulas don't work as we work universally. i.e Timesheet doesn't calculate in hours or minutes we need to convert it into seconds after we have to make it to hours and minutes. Sometimes we have to play a long shot to make it worthy dashboard!!
I can show the dashboard in a board meetings with colorful dashboards and numbers and we also inbuilt in the websites, so all the visitors can see our achievements without struggling!!

Databox allows for a single dashboard from multiple data sources to outline reporting and analytics. I've used this tool to show the performance of inbound marketing campaigns.
While using Databox, sometimes data sources don't stay connected and historical data can be lost. It is also somewhat difficult to create custom reporting since an external spreadsheet may be needed to calculate the data.
Databox helps to show an ROI for inbound and paid media campaigns for my clients. The interactive dashboards allow for anyone with the Databox link to make changes to specific timeframes. Databox reports are shared on a monthly basis and KPIs are tracked accordingly. I work for an agency responsible for using, implementing, and optimizing Databox on behalf of my client organizations. I am responsible for creating monthly reporting for my clients. Here are some of the reporting I most commonly have implemented: Website Performance = traffic by source, conversion rates Contacts by Lifeycle stage = outlining qualified contacts based on leads, opportunities, etc. Revenue = CRM data and information about the number of new deals, cost per deal, and closed won opportunities and revenue numbers
Databox connects with a wide variety (and growing) list of data sources right out of the box, which makes aggregated data very convenient. Its UI is very user-friendly as well, providing simple, easy ways to build and edit templates and dashboards.
I'd like to see more customization options for reports that are primarily text/annotations, and images/screenshots. The formatting capabilities are pretty limited for visualizations that aren't charts or graphs.
We are able to build and manage reports for dozens of clients in one platform, as well as easily share dashboards with clients.
It has a large number of integrations with various applications that are quite useful in the world of digital marketing (facebook ads, google ads, salesforce, twitter ...) which is quite practical when requesting a report from or analytics operation of our strategies, in addition its interface has a fairly neat and clean design that allows me an uncomplicated navigation at all times, the fact that it has the mobile version for me has been quite useful and effective, since it allows me to have access to all the information I need from my phone, without worrying about where I am, the reports that it issues in my opinion are quite complete as far as information is concerned, they have been very useful to me to design and rethink strategies that allow a faster growth of my company's marketing.
The only complaint I have in this regard is the fact that the reports are not customizable, that is, I am obliged to select a weekly or monthly report, I cannot select a range of dates of my interest to analyze.
It has become my right hand to analyze the effectiveness of the strategies that I have proposed in my company in terms of digital marketing, which has allowed me to make modifications to my strategies if necessary.
Databox has some options when it comes to tools integration, this feature helps the user to do their tasks easier. The data sharing feature also helps me since I work with some workmates and do that a lot. I also think that the visualization is great.
The price is quite pricey. Even though I think the performance is great, it is still expensive.
Overall, Databox is enough for me to analyze my market research data, the reporting tool is also good.
I have used several tools for data visualization like Tableau & R Studio, however I feel that Databox is the best out of all of them. The integrations that are offered are the best in market, it supports most of the software and tools we already use thus the transition was quite easy.
The designer dashboard is what got me totally confused. Rest everything was great!
We use Databox to mostly support the visualizations we need in our reports.
It's very easy to use and had all the connections we required. The customer service team is great and is ready to help at all times we had technical difficulties. The best part about it was the hourly refresh which gives an edge over other softwares. It keep our team on our toes and informed about everything.
It is very much difficult to see the custom queries which is painful. The data sometimes gets very small for the normal readable size which is bad.
We use it mainly for visualizations, this tool comes very handy when coupled with Tableau!

I love how it brings all of your collected data into one place and allows you to customize the experience so it is easy to share real data and real results with customers, clients and co-workers.
It can sometimes be cumbersome or confusing to create new templates for data or to edit data. There are also a few limitations to what data you can present. But, I imagine they are working to roll out more offers all the time.
I am able to get rid of the extra time it take for me to manually create reports for clients and am able focus instead on analyzing the data to better serve my clients needs and goals.
I like this tool because it collects all performance ratings from different tools and puts them as one that makes it easier to view and saves efforts and time.
The scalability of the tool can be made to even a wider variety of social media and other databases.
Databox is a powerful tool for tracking data from many sources. We are using a Databoard with charts and numbers from Google Analytics, FB, Twitter and Stripe! Amazing to show on our 50" TV!”

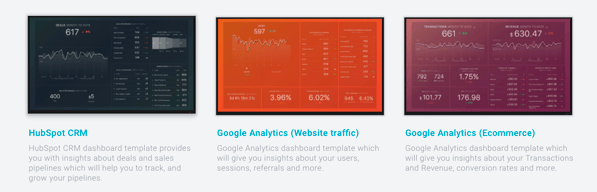
What I love about Databox is that it has built-in integration with HubSpot and comes with tons of interesting pre-baked report sets about social media, sales pipelines, and
Some of the custom report building can be a little clunky and unintuitive, but this may have to do with how HubSpot data is laid out on the backend. I happen to be familiar with how HubSpot organizes its data since
We use an API to report out of Power BI, but there are some reports that Databox has built in that I can't figure out how to build in Power BI (that probably require much more SQL/query language knowledge than I have), so Databox is a nice alternative. On top of that the execs always love a "prettier" data visualization style that is easy on the eyes and just a billion graphs shoved in their faces.
Good User interface, intuitive to use, user friendly
too many options to choose from, which is sometimes confusing
analyzing the data collected from transactions
I love Databox. The UI interface is amazing, and I love the gradient used throughout the website. Databox has smooth controls and allows me to view all analytics related to my work.
Nothing that I found that I dislike in databox.
Databox helps us to track the performance of our company, teams and individuals anytime and anywhere.
I find helpful that Databox allows you to customize dashboards by colors, brands, metrics etc. It is reasonably priced as it varies on the growth of your business anywhere between free to $248 for established businesses.
The system has a glitch which doesn’t allow you to automatically switch currency. For my personal experience I needed to switch the currency to Euros and it would only give me the option to use dollars which made it more difficult for my clients to be guided financially wise
Databox gathers all your metrics in one place and helps you deliver the KPIs across multiple devices

it is a good tool and it is useful for the company as well
it is not cheap and you have to download it with others
I used it for data collection and visualization.
I like best that Databox provides all of your sales metrics in one place combined with multiple data sources. So you can have all your business to business sales combined. It’s very easy user friendly. It really tracks the performance of your company.
The only dislike is that some key features are missing. It’s hard to discern between traffic sources and points in time as well as different dates because of it being too white of a interface. I would definitely add some color to make it easier to read data.
We have solved making client reports quicker and more interactive with the use of Databox. It really helps to also notice sale trends. Very clean.
Easy to use no big issues at this time- still learning product
Change in currency based on country you reside in
Easy to use: no big issues
The UI interface is really great and the smooth controls are top notch!
I have noticed that occasionally the data appears to show a little odd when using an iPhone app.
It's a great way to connect and centralize all of the data sources I have into one space.
Databox is perfect for creating data visualizations. It also has customizable dashboard.
The software is not entirely free. You have to pay extra bucks to fully take advantage of the tools.
I use databox for doing analytics and generating decent visualizations of my data.
all data is connected in one place, visualized dashboards, monitor progress toward goals, helps to track the performance of paid campaigns helps measure and evaluate marketing activities easy to share marketing performance with executive management
complicate to create new dashboards without using templates, and to create one dashboards with 3 different sources
Helps measure marketing activities. keep team focus on target helps optimize paid campaign and other marketing activities to achieve goals on time share dashboards to give better insights to team members and management.
I love that it gives you real time results on one screen. This makes it so easy to check from a marketing agency perspective.
It's really confusing for clients. They usually hate it, never use it, or ask tons of questions. Once they figure it out, they really dislike that they can't personally change the date ranges.
It honestly makes gathering data for reporting a lot easier! Even with the downsides, it still saves me so much time when putting quarter reports together.
Databox connects to all the services that I use. The connections are very easy to setup and all the "Deal info" comes over from Hubspot very easily.
I would have liked the Hubspot Contact info to come over also, but the contact info is restricted to whatever "smart lists" you define which is a workable solution.
A single place to see the key activity markers in my business.
I loved the large number of integrations that you could put together. Also, the fact that you easily build visualizations off of current data points and get historical information was a plus. I like the mobile app, the goal tracking, and the daily alerts as well.
I didn't like that I couldn't select date ranges of YTD in most of the widgets. I only had options focused on the month or last 30 days.
Easy heads-up display of data with a super robust set of integrations.
It's easy to use and intuitive, it took me about 3 hours from sign up to set my PipeDrive DataBoard.
I think if it had a live chat for support it would be much faster to do the onboarding.
Data Analytics updated everyday from our sales team.

The new goal-setting features are quite nice. The design is professional.
Seems like there's a learning curve to get past and like it may take a while to dial in exactly what we want.
Goal and KPI tracking across multiple platforms and systems.
I specifically like the templates, so we don't have to do everything ourselves
The small number of databoards in the free account
Overview of your online performance at a glance
Was attracted by the good looking scorecards of Databox - they give an instant overview of how our company is doing on various platforms, including Mailchimp, LinkedIn and Google Analytics.
Usage of the free plan is very limited in terms of users and scorecards
Databox supplies all the metrics on one single source
easy to install, connect to other softwares, cool graphics and dashboards
no option to set default currency throughout all databoards
monthly reports