
Amplitude Analytics Reviews & Product Details
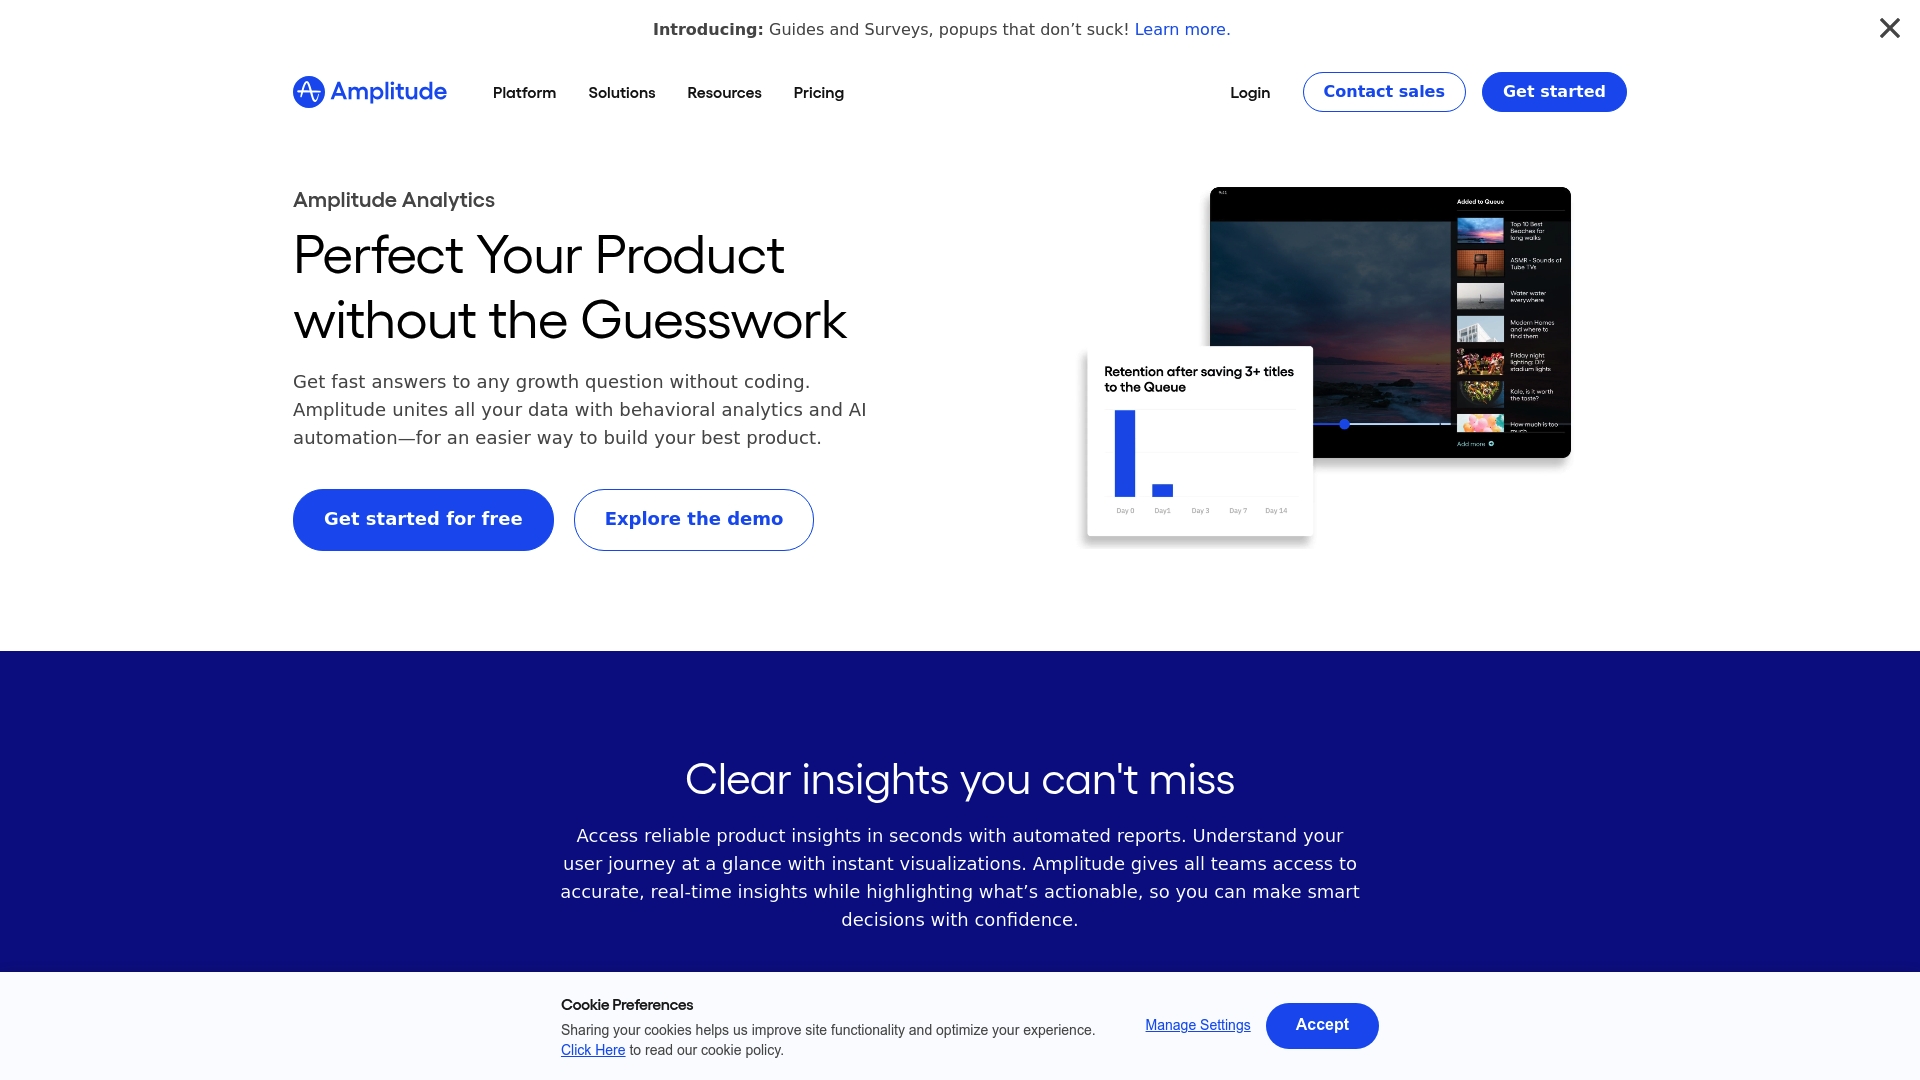
Amplitude is an analytics tool designed to support businesses by helping them understand user behavior and giving them key insights that can help them improve their products. It offers tools such as behavior tracking, funnel analysis, as well as A/B testing that combines to help companies make data-driven decisions that optimize products and drive business growth.


| Capabilities |
|
|---|---|
| Segment |
|
| Deployment | Cloud / SaaS / Web-Based, Mobile Android, Mobile iPad, Mobile iPhone |
| Training | Documentation |
| Languages | English |


The ability to slice and dice analyses and also the user lookup feature
If your labeling isn't organized, easy to get confused with naming taxonomy over time and create conflicts
Ability to understand impact of experiments
The configurability and flexibility. We get a lot of information we need to track.
The complexity of the UI. Someone who purely into data analysis and setup would probably figure their way through it better.
It tells us the success and issues with our product through metrics. Measuring usability is a key way we know we are building the right products.
I really enjoy how interactive the data dashboards are. I can click on a data point and find references for why things are improving or declining.
I don't really have any feedback on what I dislike
Its letting me know how our product launches are being received by our members. I can see when something is underperforming and deep dive based on specific data points
I love how Amplitude makes it easy for team members without technical data background to extract meaningful insight quickly. This is extremely helpful for the team to make data-driven decision.
Amplitude is pretty barebone, which allows team members to extract fundamental insight quickly. However, it's not as intuitive if you would like to look a layer deeper to extract more granular insight.
As a marketer, it enables the team to see the impact and outcome of the marketing campaigns very quickly in real-time. That's super helpful so we can do reporting and share success and learning quickly.
Easy to integrate, APIs are well designed
Reporting / data analysis can be a bit confusing.
Allows us to analyze user flows and see if there is a place where people abandon.
All the different, reasonable and customizable ways to slice the data and journey
Support has gotten a little worse in response time over time but still good
Product analytics - indispensible in how we analyze our business (e.g., ads, product changes)
I absolutely love being able to build off my colleagues' created graphs and charts to expand into additional data that I might need. We've been able to pull in Amplitude data and combine it with other analytic tools to be sure we're measuring the right thing.
There can be a steep learning curve to Amplitude at first. There are learning widgets that can help with this. Really it just takes dedicated time to learn and understand.
Amplitude helps us understand where our customers are at. We can see retention from different cross-sections of users so we understand who is using our app to its best ability and who needs a little nudge in the right direction.
I love how easy it is to track customer engagement in our apps by looking at how they navigate through our pages and interact with our app.
Nothing I can't think of at the moment. The product fits well within the requirements that we were looking for.
It helps us understand what parts of our apps are high traffic and give us insights on expiriemce bottlenecks
Vast data, and very descriptive data def
Not easily ingestable for data exports into csvs
User event tracking for user conversion
Amplitude is quite intuitive and it's easy to build a chart based on your questions. This ease will also depend a bit on how well your company has been in creating solid and consitant tracking.
When you build a dashboard is not so easy to create single filters that apply to all the graphs. There is a way but not always very intuitive. There is no way to change the date range for all the graphs within a dashboard (or I haven't found it yet)
It helps you understand how your product is being used and make data more visual. It helps you also to create segmentations and target them with communication if necessary.
Funnels, user segmentation, cohorts, etc. All of this features make it easier for the product owner to make informated decisions
Sometimes amplitude can be a little "Stiff". It lacks the versatility that other BI tools like tableau or power bi have in order to create custom reports
It's solving the lack of information when making product decisions and also the effectivness that new features and changes have.
Segmentation, Funnel analysis, adding and updating new events and also user lookup.
Cannot see more than 90+ days of data and user behavior.
Amplitude is helping me to see the day-to-day data easily and to improve my product based on the data. Easy to define and add new events.
The easy to use interface makes finding data points very simple. This enables other stake holders to query information themselves as well, without the need to run SQL scripts, etc
Some features are missing for my usecase. For example, alerts, although very useful, can only be set at an hourly rate. I needed more immediate alerts. On alerts, I am not able to set more than one condition, This makes it impossible to remove outliers from these alerts, decreasing the utility of the alerts.
Looking at events and data very quickly without needing to query makes it possible for all stakeholders to be data driven and independent. This leaves more time for analysts to spend on analyses and not simple data reporting.
Building Audiences & Segments is super easy, and the components you do build are easy to reuse on subsequent charts.
I wish it were easier to pivot data for a given measurable by some cohort, segment, user activity, or attribute.
It helps me understand where our users are succeeding with their experience in our software solution. It helps me better understand which problems I should solve first.
Retn=ention, Funnel and stickiness feature of Amplitude.
Sometimes user lookup feature gives problems.
It solves all my detailed daily analytics. live tracking of each feature by creating dashboards. conversion funnels.
Great flexibility and highly customizable. Very simple to define event and user propoerties, understand conversion, drill down to understand cross-sections or zoom out to understand aggregagte trends.
I only wish it were clearer/ more intuitive for new users to understand that when looking at event A to event B conversion, adding filters by user properties means filtering by that user's property *at the time of the event.*
Amplitude Analytics empowers Product Managers and operations, marketing, and growth teams to conduct advanced analytics, therefore, freeing up capacity from our Data and Engineering teams.
I'm not a data expert, but Amplitude helps me analyse data quickly and easily without getting help from data analysts all the time. It is very easy to learn and use!
Unless the events are set up well for tracking, it can be a little difficult to use, and you can't use it to analyse everything. It will most likely still cover most events for basic analysis.
Amplitude Analytics help us to make decisions based on data in our day-to-day. It also helps us track our impact as we launch new features compared to baseline.
Amplitude has a very simple UI and it's quite easy to onboard even non-technical users, over the past 2 years we manage to onboard more than 100+ users from different departments, and more than half of them are actively using the tool for various analyses on a weekly basis. We have received overwhelming responses from our stakeholders on how easy it is to use Amplitude and discover new insights.
One of the biggest challenges with Amplitude is their metrics definition, the tool has its own way of identifying unique users/ customers which don't align with our internal definition resulting in a different stats when we compare it with our internal source, we often get called out for this and it's nearly impossible to explain it to our stakeholders.
Amplitude is mostly used by our product managers and designers to understand our user behavior across different touchpoints and evaluate areas that need further improvement.
Easy to navigate and understand. Redcues manual effort.
Limitation on the date range for a report.
We are using Amplitude mostly for gauging the performance of our clients' marketing campaigns along with the general health of their apps. Use case: (a) To easily report on KPIs like installs, CPI, CPO, etc (b) Understand user personas. (c) Create cohort of customer and understand thr shopping behavior.
I like amplitudes ability get get deep into the data, explorer customer behaviours at the microscopic level
The unclear limitations of the cross-project function such as the lack of drop filters
The funnel tool is great for exploring areas of improvement across a users journey through a conversion flow


