

Unclaimed: Are are working at Zoho Analytics ?
Zoho Analytics Reviews & Product Details
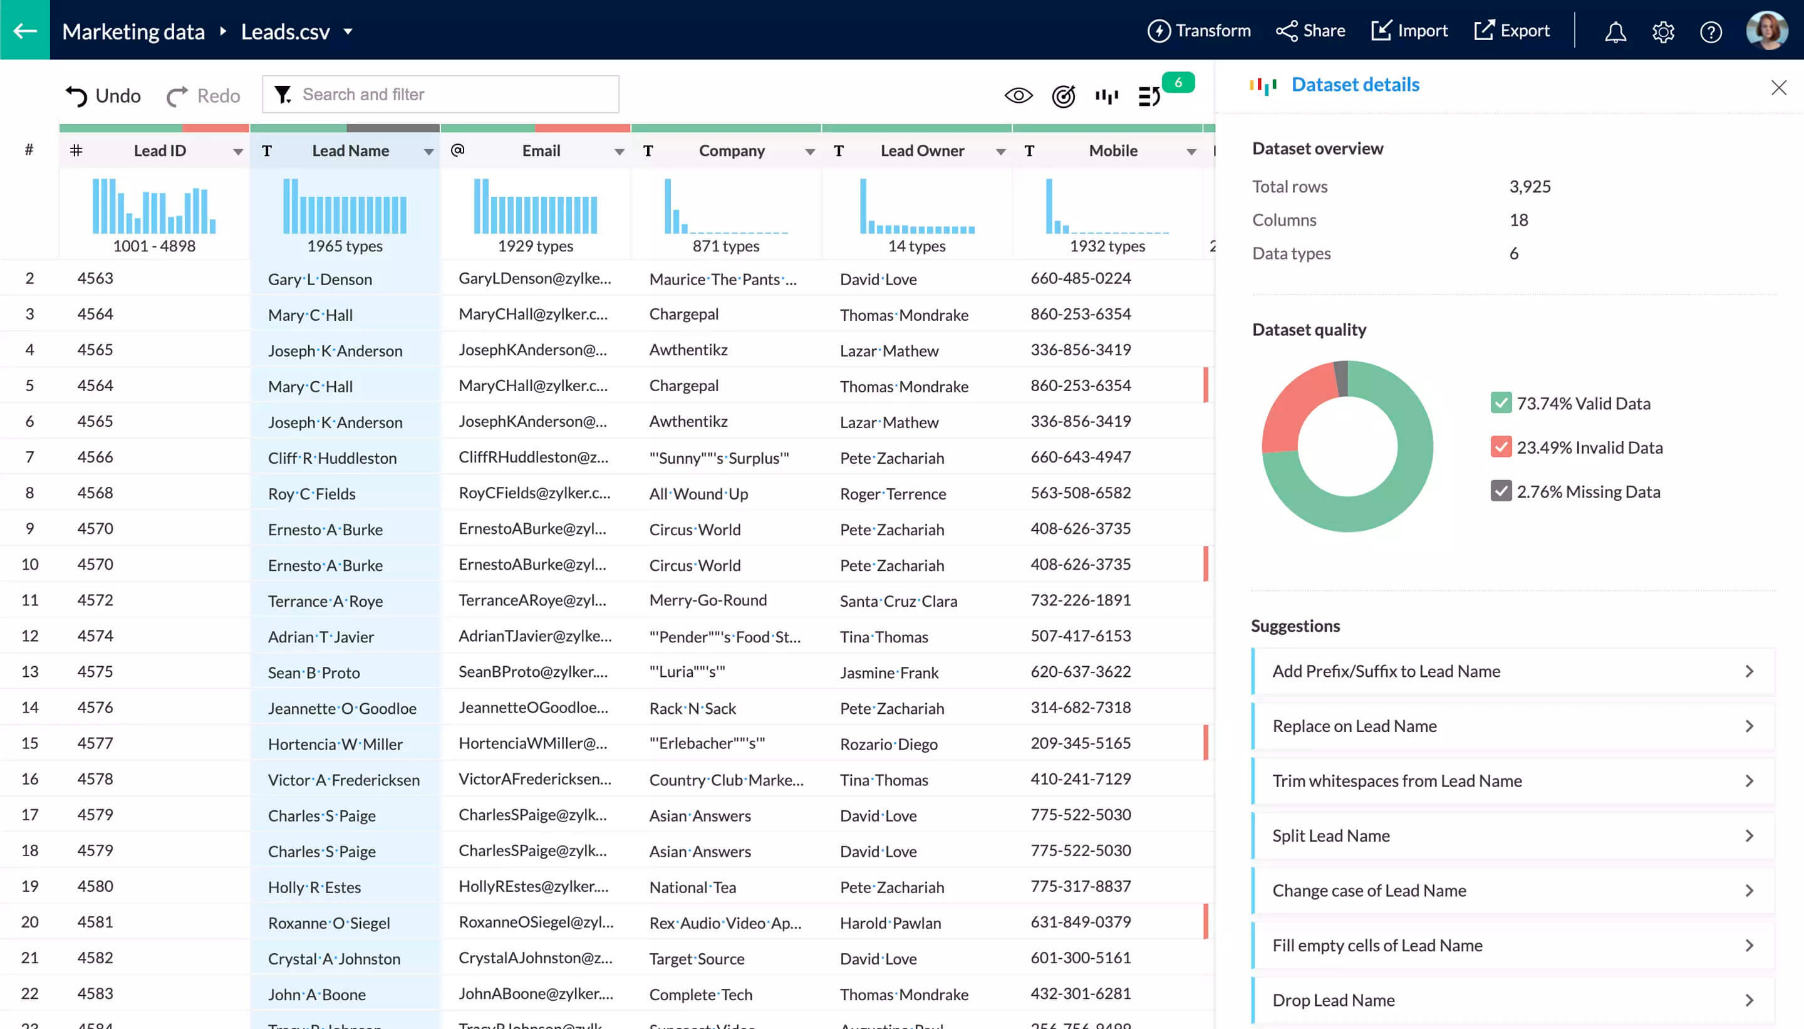
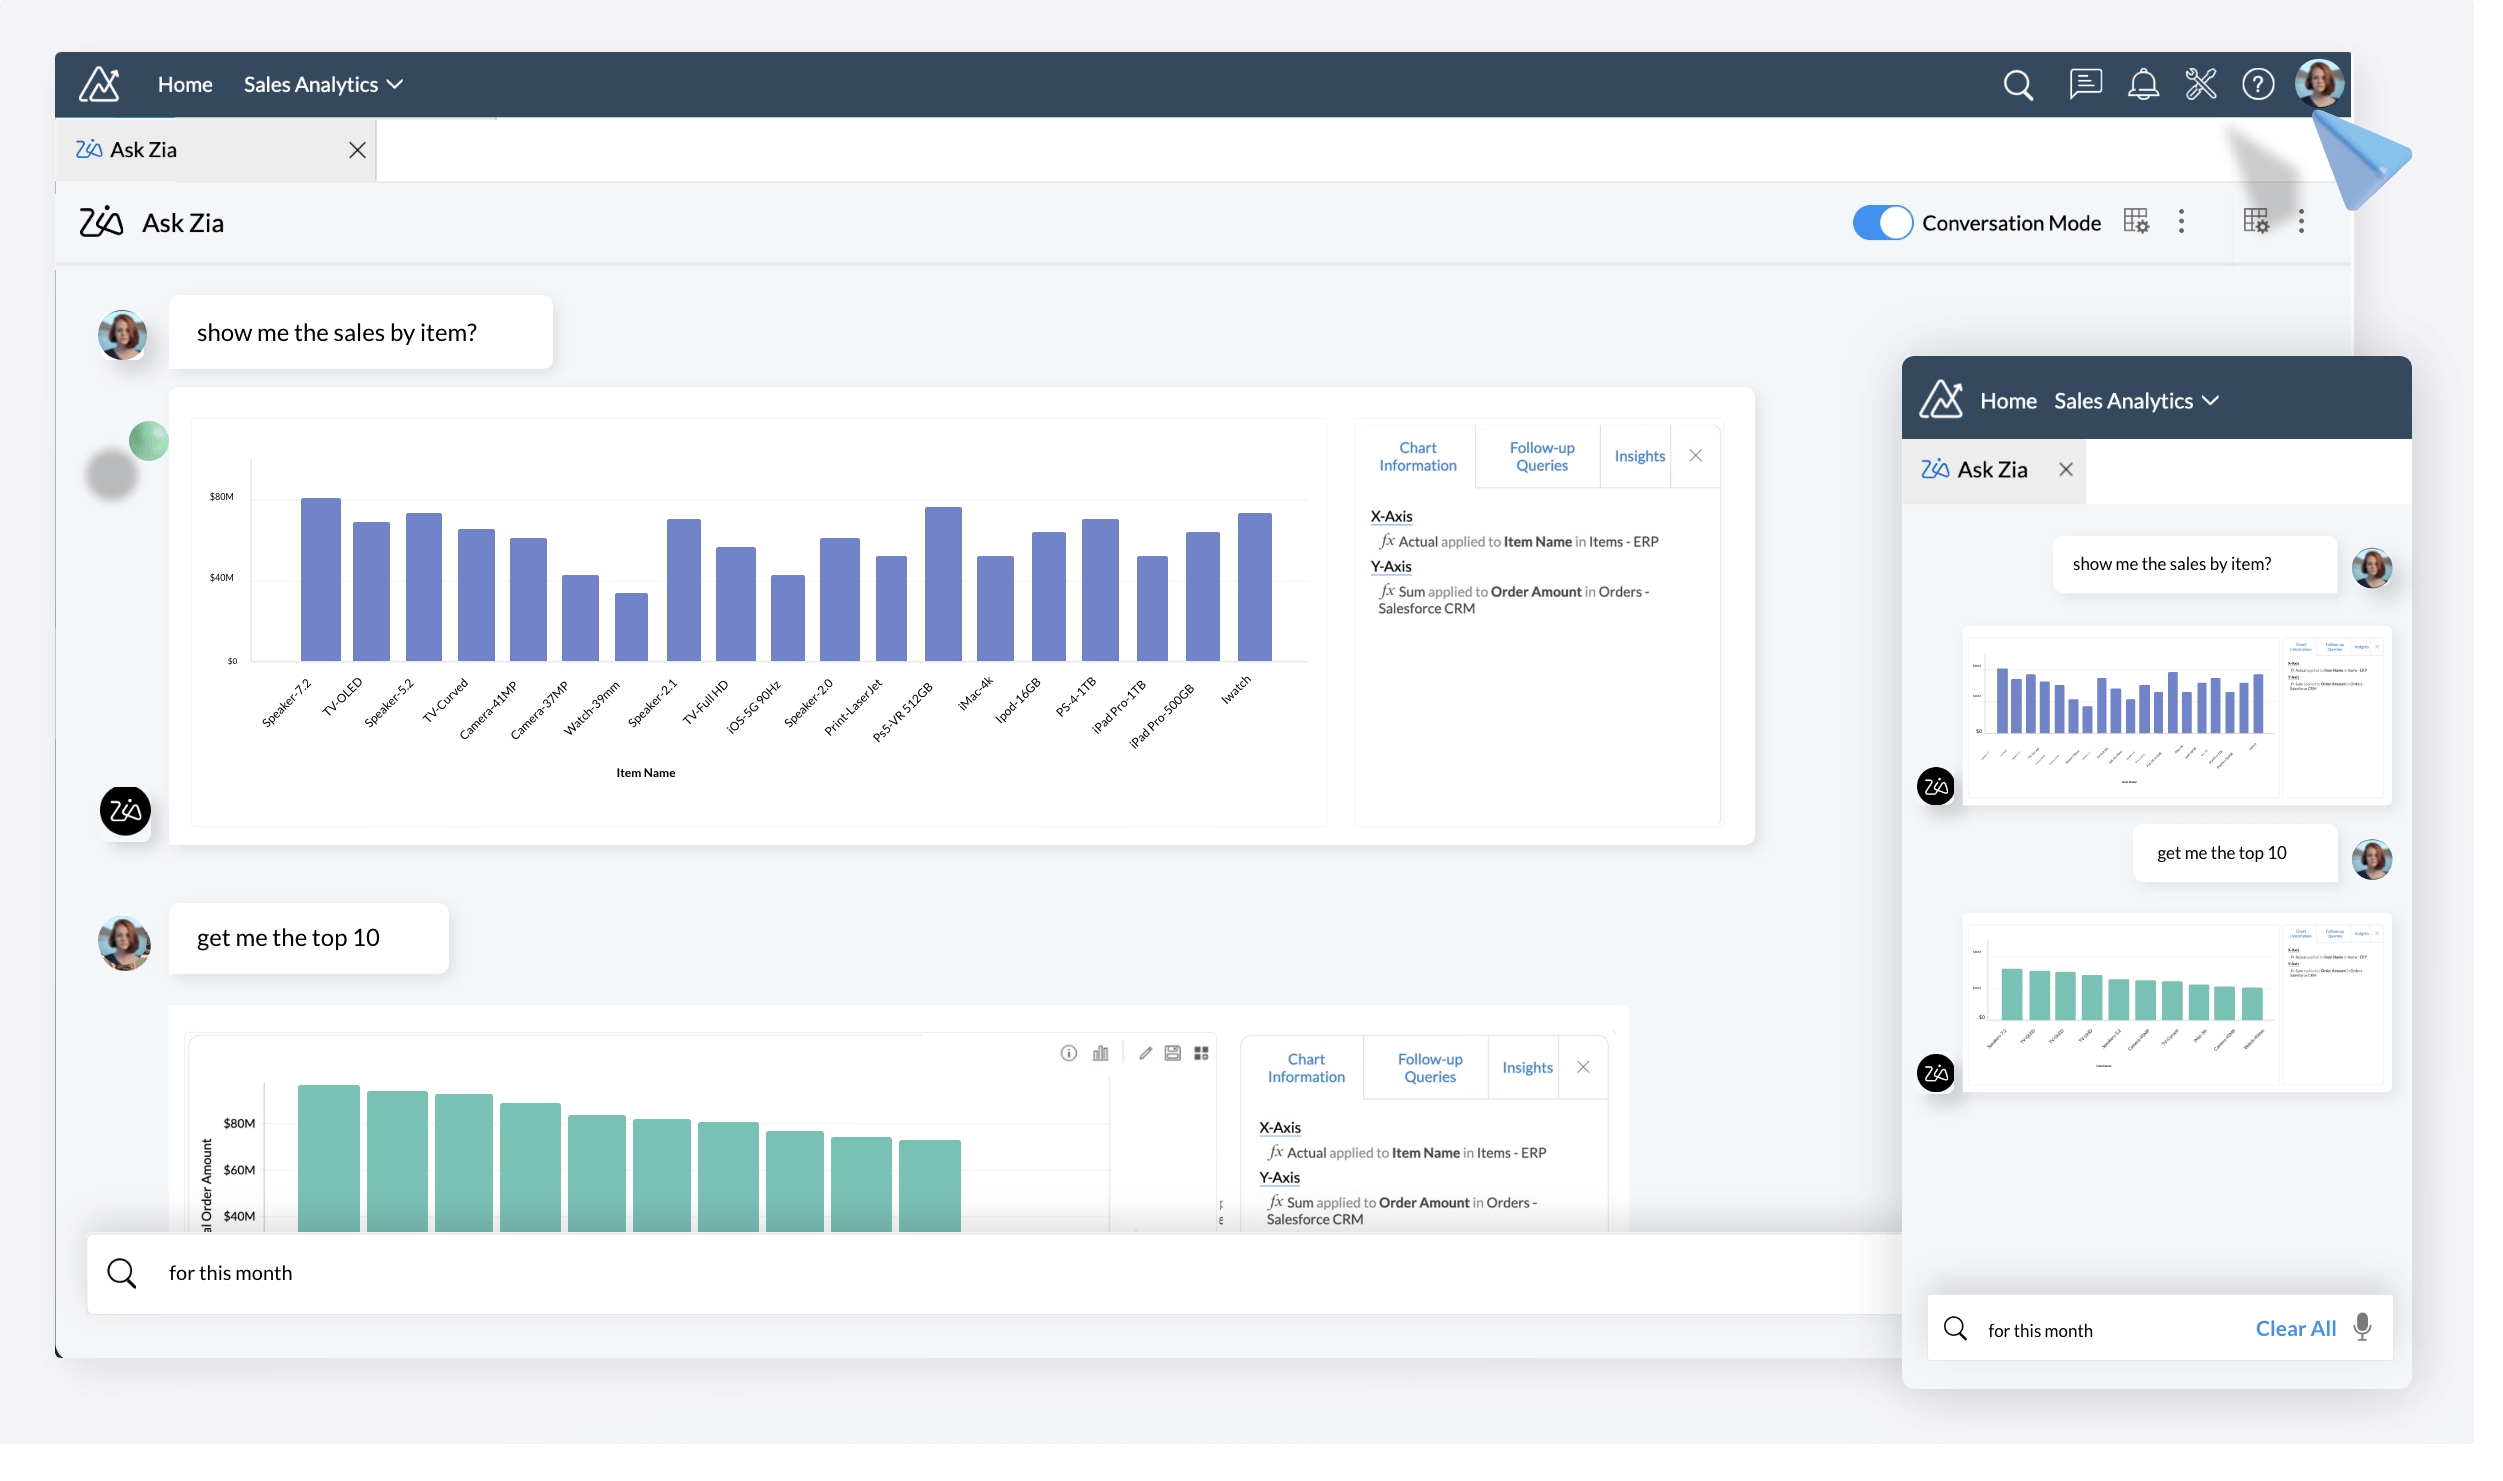
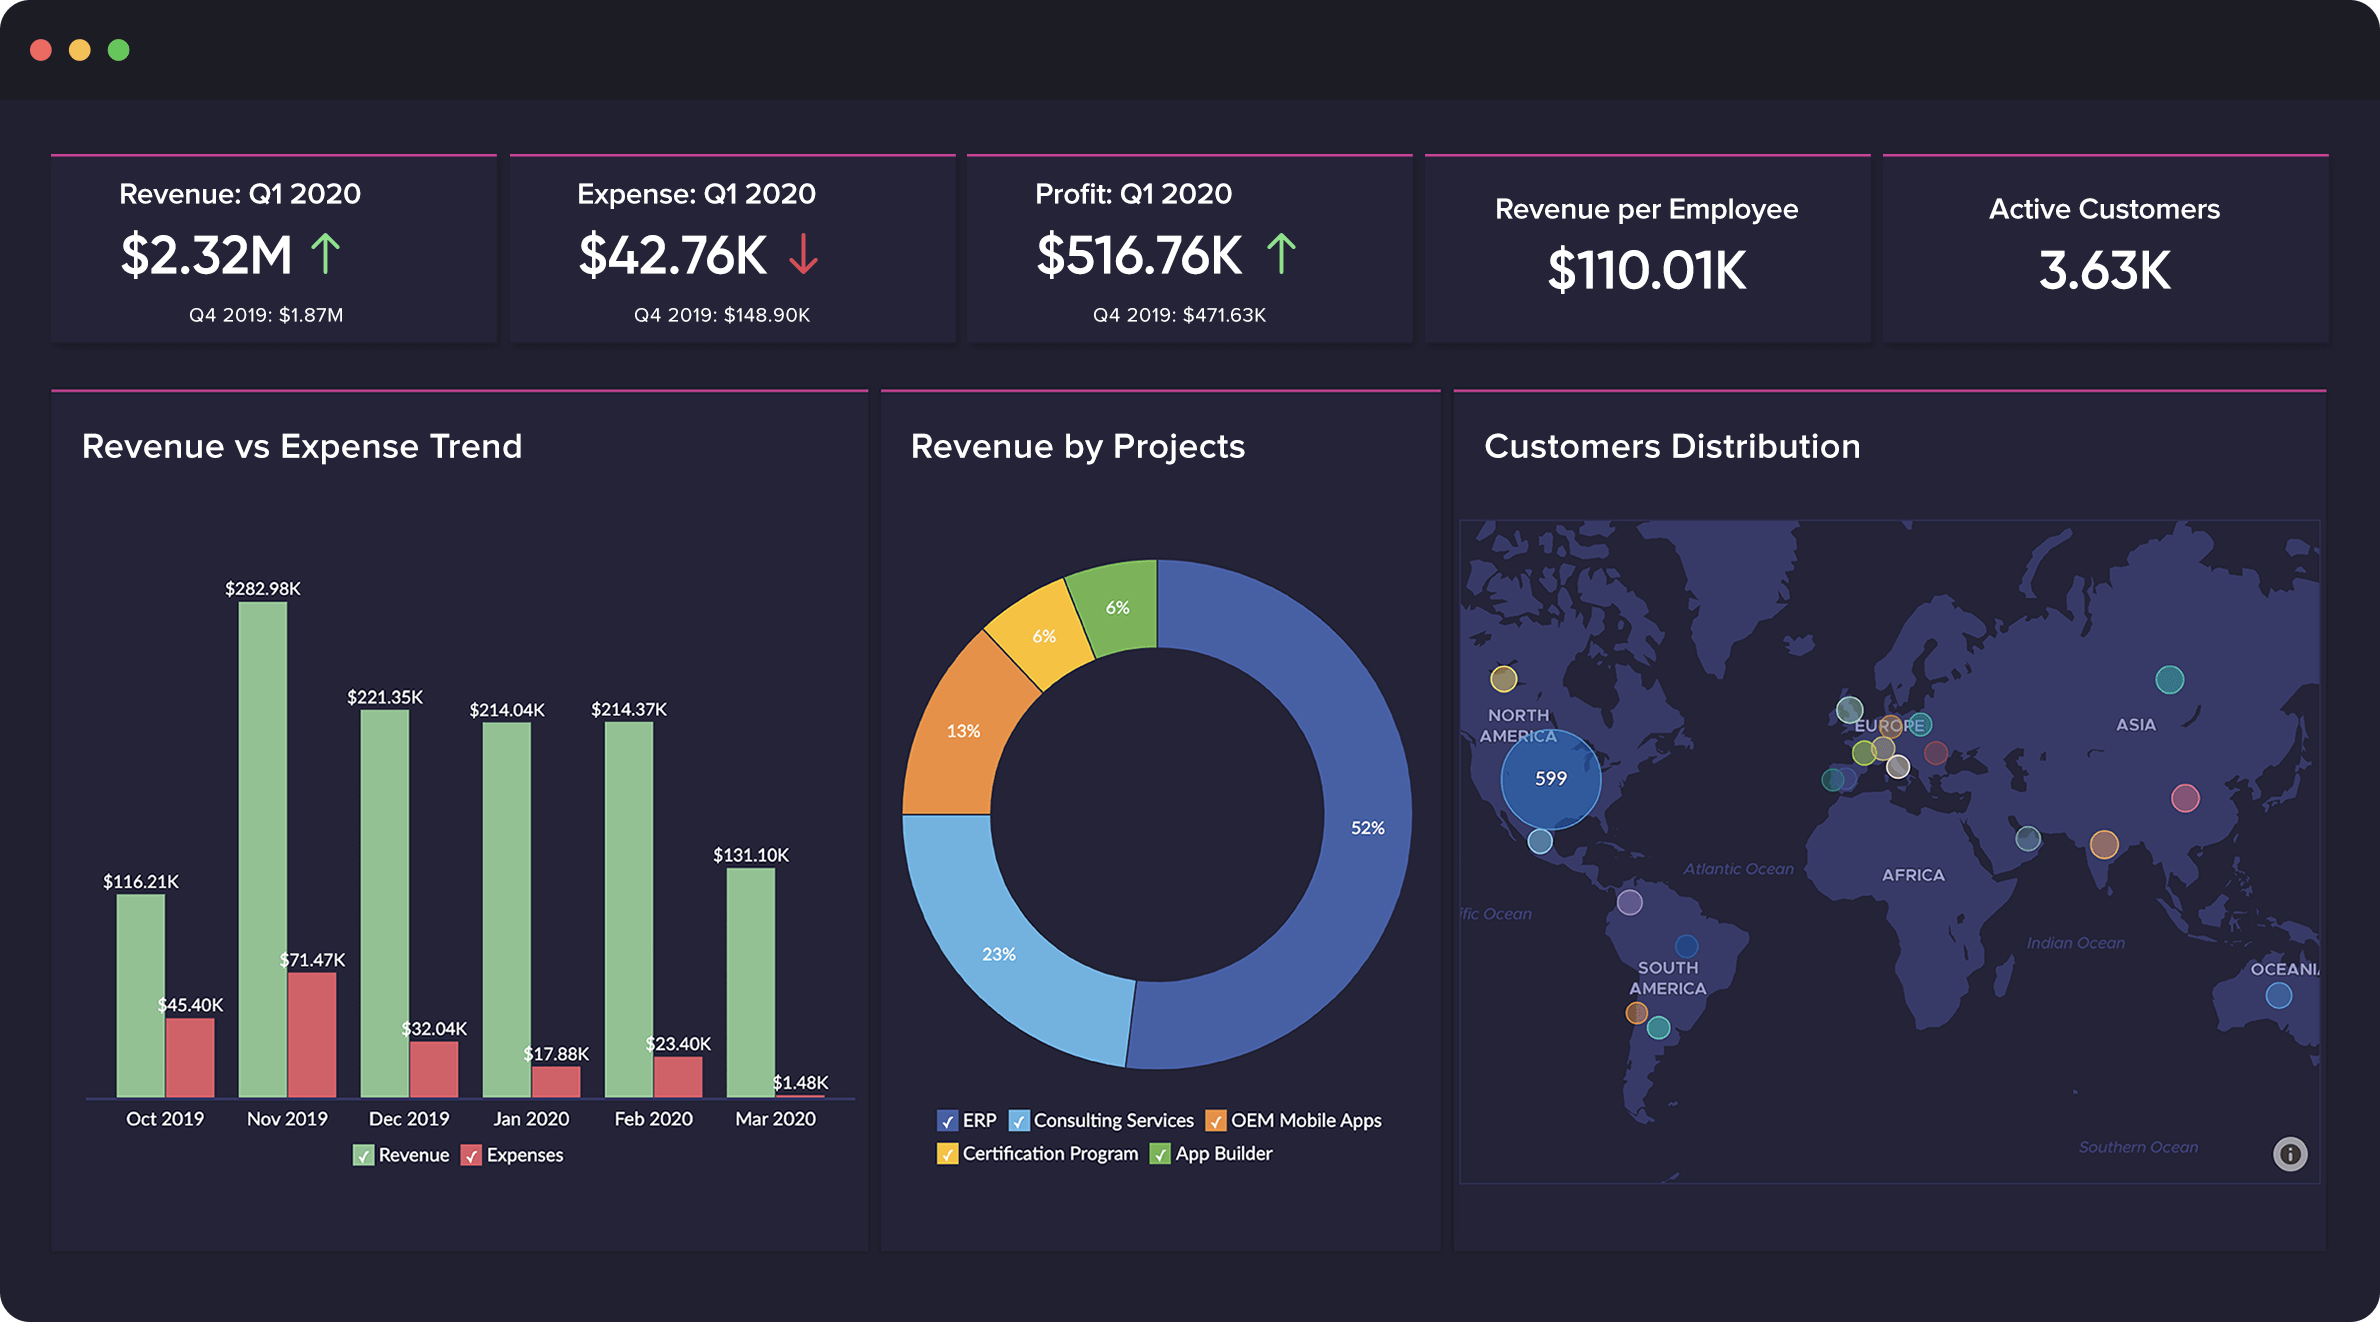
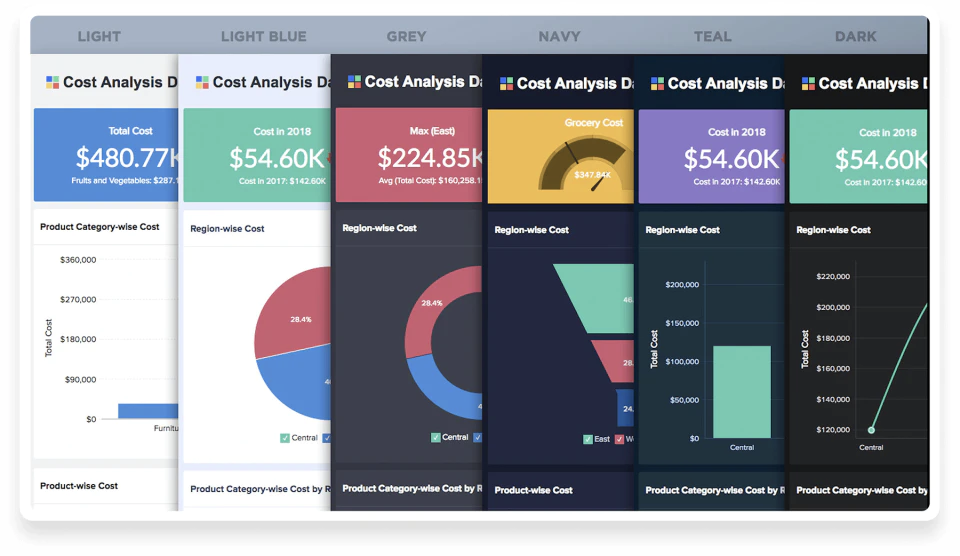
Zoho Analytics is a business intelligence tool that allows users to transform raw data into meaningful insights and visually appealing reports. It stands out from the competition with its intuitive interface, flexible data modeling capabilities, and seamless integration with other Zoho apps. With features like data blending, advanced calculations, and customizable dashboards, Zoho Analytics makes data analysis accessible and actionable for businesses of all sizes.
| Company | Zoho Corporation |
|---|---|
| Year founded | 2000 |
| Company size | 10,001+ employees |
| Headquarters | Chennai, Tamil Nadu |
| Social Media |


( 1 )
| Capabilities |
|
|---|---|
| Segment |
|
| Deployment | Cloud / SaaS / Web-Based, Desktop Windows, Mobile Android, Mobile iPad, Mobile iPhone, On-Premise Linux |
| Training | Documentation |
| Languages | English |

Compare Zoho Analytics with other popular tools in the same category.

for me Zoho Analytics excels in data visualization
the billing is slight high for me as a small business
it offers a user-friendly interface that enables even non-technical team members to dive into data analysis effortlessly. Its drag-and-drop functionality allows to create visually appealing dashboards and reports without the need for coding or advanced tech skills. This accessibility ensures that our teams across different departments can quickly leverage the platform to make data-driven decisions.
Zoho Analytics is one of the best tools available in the market for connecting data from anywhere, preparing data for analysis, document analysis using AI and creating an attractive and super cool data pool for reporting. The best part is that the tool offers most of its free features, which adds to its significance in the Indian market.
Zoho Analytics offers most of the features a data analysis software requires but needs improvement in handling extensive data. This tool is still in the learning curve, so many changes in AI and parts must be made.
Zoho Analytics is best at blending data and preparing valid and excellent data points and reports using AI. Earlier, our organisation used to handle data using different tools that were not that much AIpowered, but with Zoho Analytics, our issue is resolved.
The feature of allowing collection of data from various apps into one app. It is very user friendly.
It gets slow down sometimes so interface needs to be improves. Customer connect should also be done better.
It is a very feasible platform for analyzing larger data. It also gives a lot of knowledge oglf SQL queries. The innterconectivity is the best feature. Any type of report can be created with any type of file format
The best part about Zoho one is the set of features that it provides at this cost.All the OOTB bundle of apps for different features is really amazing. It covers most of the use cases for a standard CRM implementation
There is nothing much to dislike considering the cost of the licenses. Infact there are a lot of apps which are free to use as well. Only thing is if they could give some ootb Industry vertical use cases as well, it would be amazing
We are now using Zoho as our Primary CRM system which is then linked with our Marketing, Billing, Invoicing and Analytics platform as well. It is like the core of our Digital Revolution
The communication between team members was what we liked best
One think we disliked about zoho one was the cost
Zoho One kept everything for the team to view in one location
How it integrates with the rest of Zoho Apps and how easy to use once you get all the data on the CRM and the rest of them, you can collect all data from all apps in just one.
First you need to get all of the information in the Zoho apps for Zoho Analytics to start working, there is no way to get data from previos and different tools.
We didnt had any understanding and metrics about are sales team, this tools has helps us know the behavior or our sales team and how to help the be better and get more customers.
Ease of integration with all the Zoho products and services we have subscribed to. The insights provided on the sales and marketing efforts is fantastic! The feature to seamlessly import data and custom options to prepare data for analysis helps analyze historical data from previous financial years.
Nothing to dislike regarding this product as of date. It serves its purpose as expected. Maybe support from Zoho team can improve to speed up the issue resolution process.
It helps provide a numbers-driven and analytical view of all our business processes with the help of integrations done with the other Zoho products and keeps track of all interactions and campaigns with our existing customers. Graphical or visual representation of data helps provide custom updates to directors and members of leadership teams.
The stability of the features utilizing the latest technologies such as cloud and Saas, making the user interface easy to use and understand by anyone including a non-technology person.
I have nothing to dislike, as I have found it to be very unique in how it supports all business processes in one place and makes the business management chores easier.
The Application has centralized administrative control from one single console. This helps in managing, connecting, and automating business processes across the organization.
I have not used every tool, but I am using the invoice system. And is one of the best when compared to other invoice tools. I will definitely recommend it to my connections.
Paying for each member after my sign-up is a big disadvantage and is a little bit hectic. I am always stuck while paying and a bit slow process. It feels risky.
The best thing about the Zoho one is, getting all the best kinds of and useful tools in one place. It saves our time and money and our work process easy and comfortable.
The ability to connect to different databases and an excel pivot-like interface along side SQL
lack of visualization tools and suggestive charts
custom reports are being made from Zoho analytics from Zoho crm as well as our internal product database Time to build a reporting tool has been saved

